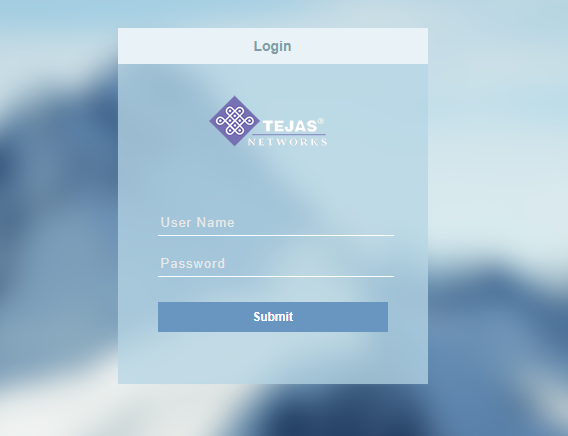
Enter the given User Name and Password in the respective spaces.
Click Submit and it will be re-directed to the Home page of the application.
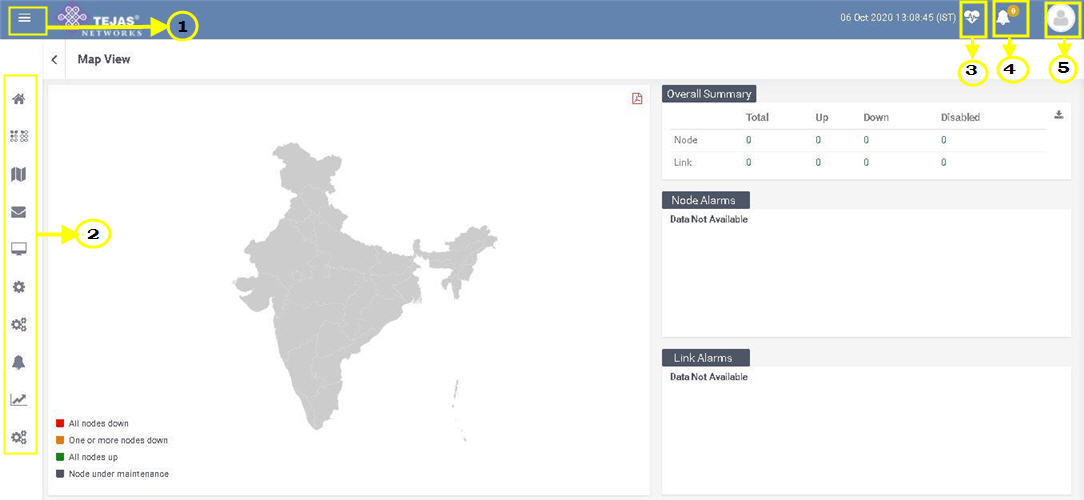
Tool Bar: Click to view expanded view of the menu panel
List of icons: the menu panel details:
Home: gives the view of Default page set by the operator in the Profile Panel.
Dashboard: gives the list of dashboards created and present in the portal.
Graphical Views: gives the Map View, Geo View, Topology View or Network Diagram of the devices, links or interfaces connected and operational status.
Notifier enables the user to configure notifier methods and alerts.
Node Inventory: displays the information of nodes discovered in administrator.
Administration: lets the user navigate to the admin console.
Alarms: display the information and status of alarms raised.
Reports: allow creating and viewing the desired reports.
Settings: allow assigning/changing the basic views of the various interfaces.
Health icon: gives the diagnostic status of the operator/user’s device (computer or laptop) by using various diagnostic options like Ping, Trace Route, SNMP Walk, SSH and Telnet
Alarms/System Notifications icon: gives the information and status of the alarms/tickets raised by the clients and license related information by pop up message
Profile icon: allows adding, editing and deleting the personal information of the operator/user by clicking on Profile Edit, such as Profile Picture, User Name, Email, Password, Phone Number and Default Page View.