This is a Privilege based feature: The user will be able to access, add, edit, delete only if those privileges have been given by the administrator. This will be defined under roles and privileges.
Reports contain Report and MRTG Report modules.
Reports
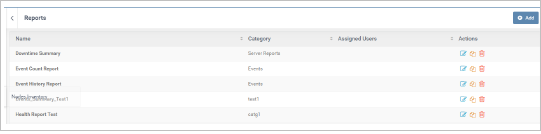
From the left panel, click and select ‘Reports’. This interface allows the user to view current and historical data in addition to create/add reports.
Standard reports are displayed as a List. Details such as Name, Category and Assigned Users can be viewed. Action icons to Edit , Delete and Copy actions reports are given.
Add/Create Report
From the Reports page, click Add to add/create a new report.
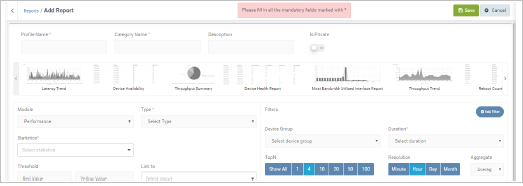
Add Report window is displayed. Basic Information details along with Pre-defined reports are displayed.
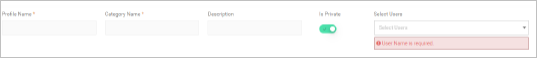
Provide a Report name in the ‘Profile Name’ textbox. This is a mandatory field, and must be 3-255 characters long.
Provide a Category name in the ‘Category Name’ textbox. This is a mandatory field, and must be 3-255 characters long.
Provide a brief description about the report in the ‘Description’ field.
Using the toggle button, choose if the report is private or public. If Private, select the users (who will have access) using the dropdown menu.
Below the Report Information column, pre-defined reports like Latency Trend, Device Availability, Throughput Summary etc., are displayed. Select a Report, as required. Based on the selection, few of the fields are filled in automatically.
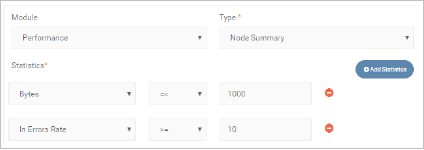
Select Module using the dropdown menu.
Select Report Type* using the Dropdown menu.
Statistics* is auto filled, based on the Report selected. Additional fields can be added using the Dropdown menu.
Unit* is auto filled, based on the Report selected. This however can be changed by selecting one of the given options.
Select whether the report must be grouped based on ‘Stat Split’ or ‘Resource Split’.
Stat Split gives the data/graph by grouping selected statistics on Y-axis and time on X-axis.
Resource Split gives the data/graph by grouping resources on Y-axis and time on X-axis.
Threshold* is auto filled. This however can be changed manually. Enter the Threshold values - red value for upper limit and yellow value for lower limit.
If any existing report needs to be linked to this report, select the link Report using the dropdown menu.
NOTE: Dynamic conditions are available for Node Summary report only. This enables adding multiple statistics and select conditional filters for the same, to be displayed in the report.
On the right side, filter fields are given.
Select ‘Device Group’ using the Dropdown menu, The Report will be assigned to the selected Device Group.
Select Time scale/Duration* using the Dropdown menu. The report will be created for the selected Timescale/Duration.
Select the top number of data to be displayed in the Top’N’ field.
Select the Timescale resolution (Minute, Hour,, Day, Month) for the report.
Use the Toggle Button to enable Business Hours for the Report. If yes, select the Business Hour profile using the dropdown menu.
Additional filters can be added by clicking Add Filter
Select the Filter Category using the Dropdown Menu.
Select and/or condition as applicable.
Follow the above steps to add multiple conditions.
* denotes Mandatory Field
Click Preview to preview the Report. Click Save to save the Report.
Report Types
There are multiple types of Reports pre-created on TJ5100-S.
NOTE: Graph does not support more than 20 data sets in the Preview Page.
PERFORMANCE REPORT TYPES
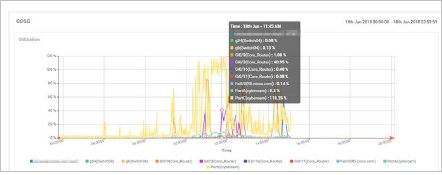
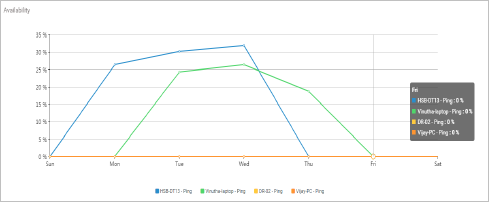
Trending Time: This report type allows plotting accurate data for the devices which are being monitored, based on the selected statistics for the selected time.
Mouse over on the Graph for exact information
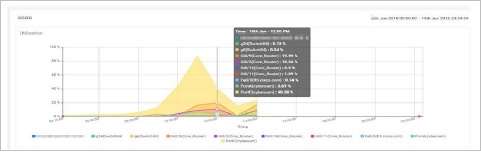
Area Time: This report type displays quantitative data for the selected devices under polling, based on the line chart in a graph format. The area between axis and line are commonly emphasized with colors and textures.
Mouse over on the Graph for exact information.
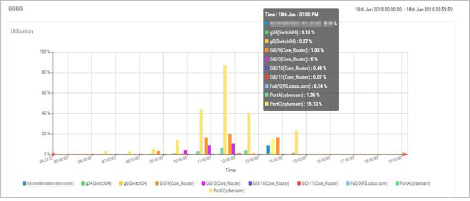
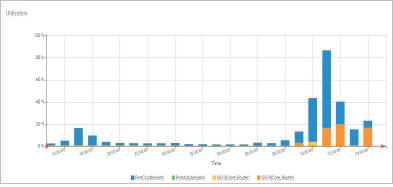
Bar Time: This report type presents categorical data for selected devices which are being monitored with rectangular bars categorized based on statistics or resources for the selected time.
Mouse over on the Graph for exact information.
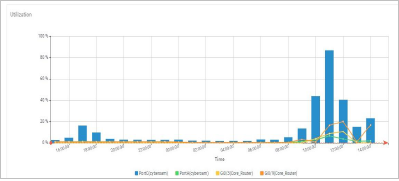
Trend & Bar: This report type is a bar graph used to represent the statistical data for the devices available for monitoring in a trend pattern with respect to time.
Stack Bar: A Stack Bar report type uses bars that represent statistical data for the devices/resources and segments representing different parts or categories of that whole statistic bar for the selected time.
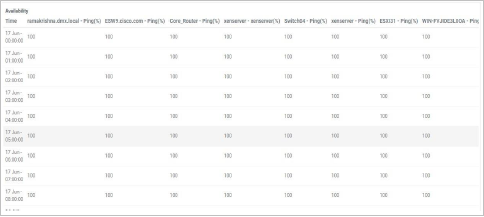
Data Table: This report type represents data in a tabular form, with columns named, where selected statistic’s data is displayed for the devices.
SUMMARY REPORT TYPES
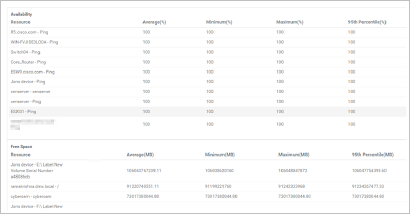
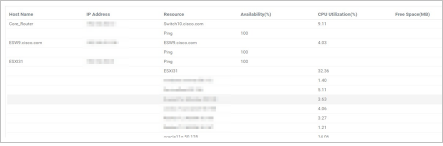
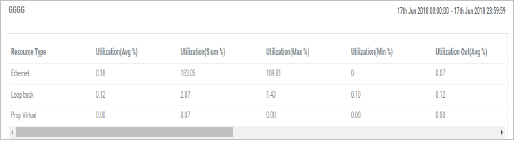
Summary Table: This report type represents summarized visualization of statistical data for selected devices which are available under monitoring into a tabular format.
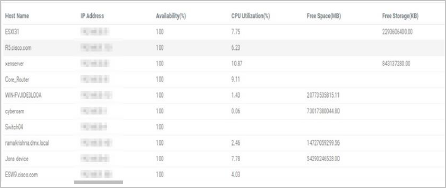
Node Summary: This report type represents summarized statistical data for selected nodes (and its resources) which are available to be monitored into a tabular format.
Node wise Resource Summary: The Node Wise Resource Summary report type represents summarized statistical data for the resources available (within the nodes), where resources are categorized based on the nodes. This is displayed in a tabular form, for the selected time.
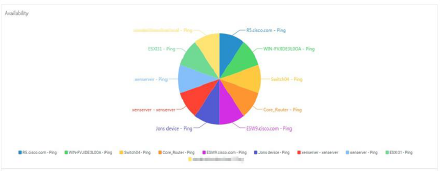
Pie: A Pie chart is a circular statistical graph, which is divided to illustrate numerical proportion for the selected statistics and nodes for the selected time.
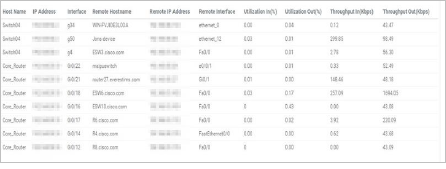
Link wise Traffic Report: This report type represents traffic information of statistics such as Throughput In, Throughput Out etc., for the links available, for the selected time.
ANALYTICAL REPORT TYPES
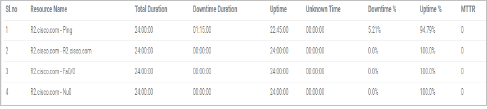
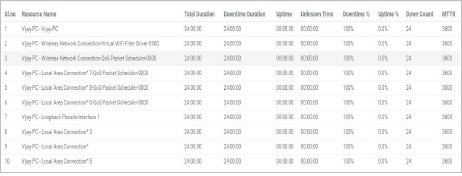
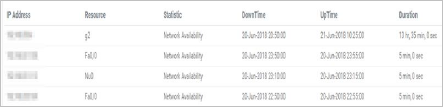
Downtime Report: This report type represents information about the Downtimes if the Nodes. Report provides details like Total Downtime, Downtime duration (each instance) , Uptime etc.
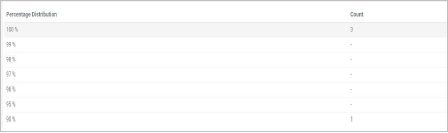
Uptime Distribution: This report type displays Time Distribution of the device.
Top 100 Down Count Report: This report provides detailed information related to the downtime of top 100 devices/resources.
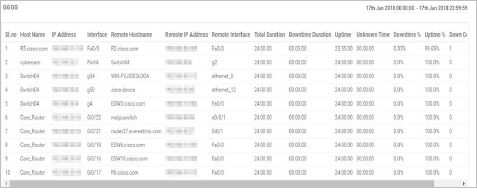
Link wise Outage Report: This report type represents traffic information for selected statistics such as Throughput In, Throughput Out etc., for the links the respective connected remote links, with respect to time.
Pattern Report: This report type displays aggregated statistical data for selected devices that are being polled, based on the selected timescale “Hour of the Day”, “Day of the Week” and “Day Of the month” format, in a trend pattern.
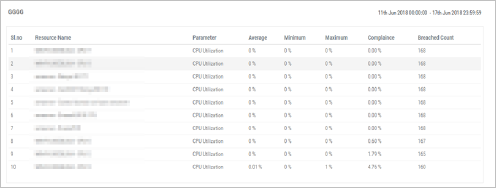
SLA Summary Report: This report type provides the compliance (in percentage) and breached count value - when statistics value crosses the configured threshold (SLA), for the selected devices/nodes that are being monitoring, at a selected time.
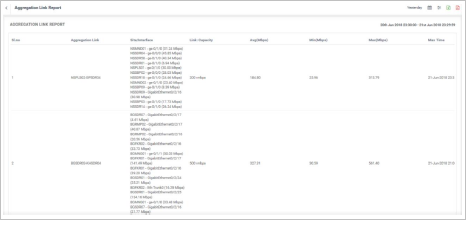
Aggregation Link Report: This report type represents aggregated data (Average, Minimum and Maximum) for individual links/grouped interfaces, with respect to time.
Stat Aggregation Report: This report type represents aggregated data (Average, Minimum and Maximum) for individual links/grouped interfaces, with respect to time.
EVENT REPORT TYPES
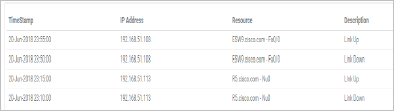
Events: This report type provides information regarding all events (activities occurring within a particular node) for the selected time.
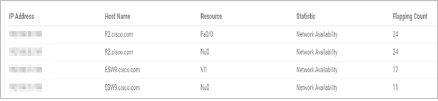
Event Count Report: This report type displays event count, which includes both Up & Down events and the respective count value called flapping count, for a selected device(s) as per configuration of the report.
Event Summary: This report type gives detailed information related to the events, when those events occurred and displays the duration of occurred events.