This is a Privilege based feature: The user will be able to access, add, edit, delete only if those privileges have been given by the administrator. This will be defined under roles and privileges.
From the left panel, click and select ‘Alarm Dashboard’. Alarm dashboard gives information of recent/latest alarms.
Multiple Icons/action buttons are available on the top right panel. All the icons have count value displayed on top, which indicates the count of alarms, in the particular category. These buttons act as a filter too.
Time filter: Click to view the calender, select the date range and time to view the alarms for the specific time.
All Alarm Count: Displays the count of alarms.The number above the icon denotes number of alarms
Filter Un-attended alarms: Click to view the list of alarms that are not acknowledged or being attended to.
Filter Ticketed Alarms: Click to view the alarms which are converted into tickets.
Filter Acknowledged Alarms: Click to view the alarms which are acknowledged.
Filter Priority Alarms: Click to view the alarms based on their priority.
Filter Root Alarms: Click to view all root alarms.
Filter Rule-based Alarms: Click to view all rule-based alarms.
Advance Filter: Click to view advanced filter options- to filter alarms based on their Device ID, Node Tag, IP address etc.
Download: Click to download the alarm dashboard to desktop in CSV/PDF/EXCEL format.
Reload: Click to reload the alarm dashboard manually.
History Events: Click to displays the history of events of alarms.
Trap Events: Click to displays the trap alarms.
Toggle Auto Reload: Allows to select auto - reloading option by using toggle button.
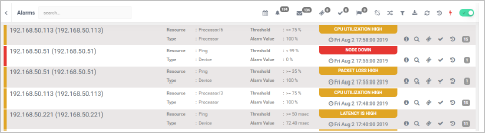
Additional information on the alarm can be found on the Individual Alarm line item.
The alarms are colour coded based on the criticality.
Details like Resource, Type, Threshold and Alarm Value is displayed.
is the time stamp of the event.
Click to view the Asset information.
Click to perform diagnosis on the asset.
Click to create a ticket for the alarm
Click to acknowledge the Alarm
Click to view Incident Audit, related to the Alarm.
Denotes the event count. Click on the number to view the Event History
Alarms marked with are the root alarms. Click to view the alarms (Child Alarm(s))