![]()
![]()
![]()
|
|
|
|
This tab gives the details related to the performance of the node such as Health Summary, Device Summary and Latency.
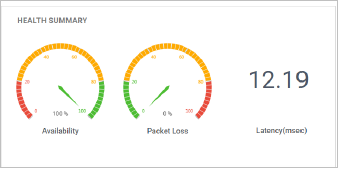
The Health Summary displays the Availability, Packet Loss and the Latency (in milli seconds) of the node.
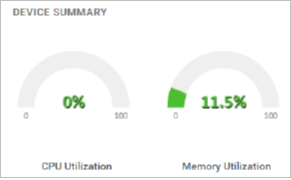
Device Summary displays the CPU and Memory Utilization details.
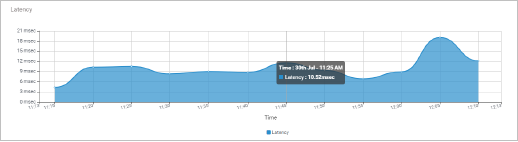
Latency area chart displays the latency level timeline. Mouse over to view additional information.
NOTE: ![]() on the top right corner of the page denotes that the information below is based on the last Poll data. Click
on the top right corner of the page denotes that the information below is based on the last Poll data. Click ![]() to select a specific Date, Date range, Time to view the performance details of the selected node.
to select a specific Date, Date range, Time to view the performance details of the selected node.