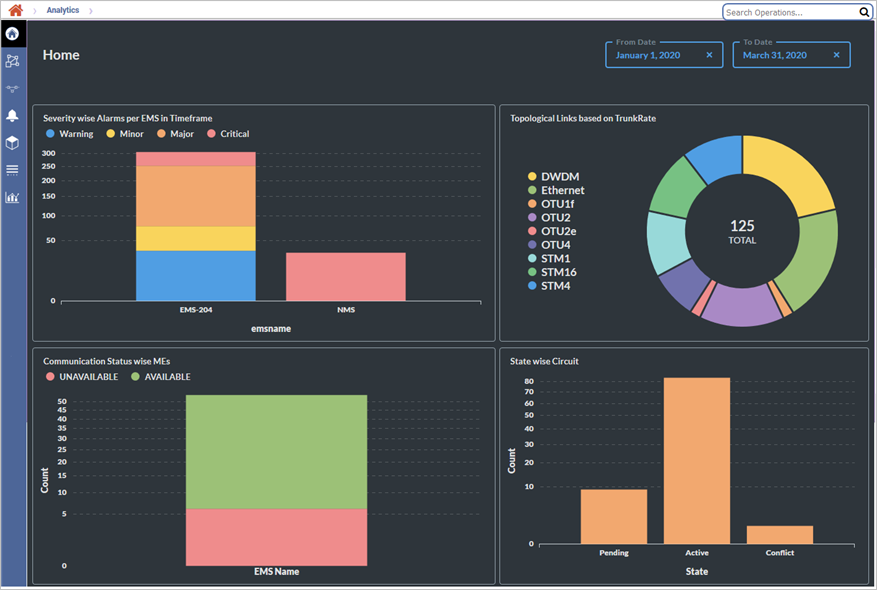
Go to Topology menu and click NMS Analytics to open the NMS Analytics dashboard. Analytics displays the overall information about the alarms generated per EMS, topological link, circuits, managed elements (nodes), ONTs and users present in TJ5500 in the form of charts which is easily understood by the user and effectively plan the network topology. The attribute values are also displayed on mouse hover.

Hover the mouse over the left side bar to expand the side-bar menu options on Analytics.
NMS Analytics Menu Options
Attribute |
Description |
|---|---|
|
Displays the information about the following:
|
|
Displays the details of topological links based on the directionality, online/offline mode, capacity, type (inter EMS or intra EMS), with or without VNE (Virtual Network Element) end in the form of bar graph or pie chart. |
|
Displays the details of count of circuits based on type, state, capacity, and protection type in form of bar graph or pie chart. |
|
Displays the details of alarms present based on total alarms per EMS, severity wise, Acknowledged Status, type of alarm in form of bar graph or pie chart. |
|
Displays the details of the nodes availability, type of node, software version, EMS Sync State, and NMS Sync State in form of bar graph or pie chart. |
|
Displays the details of ONTs based on Admin status and Physical status and also displays the details of TJ5500 users based on profile. |
|
Displays the required details of the topological links, circuits, nodes, and alarms based on the filtering criteria. |
The side-bar options are described below:
Menu options |
Descriptions |
Home |
Provides the analytical charts for:
|
Topological Links |
Provides the analytical charts for:
|
Circuits |
Provides the analytical charts for:
|
Alarms |
Provides the analytical charts for:
|
Managed Elements |
Provides the analytical charts for:
|
Miscellaneous |
Provides the analytical charts for ONTs and other systems:
|
Analytics |
Provides only the analytical chart for the desired option selected. Select the category in the Category field and the select the analytics chart in the I want to know field. The chart is displayed. NOTE: For Alarms Category you also need to select the from and to time frame and click Submit Query. |
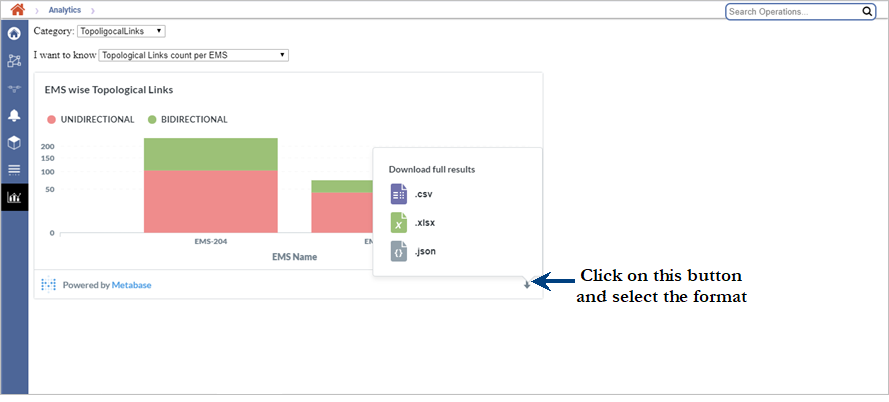
Download report from Analytics sub menu
To download the report of the analytics displayed,
