On the Network View (Nodes) tab, the right-click options supported on a node displayed are as follows:
Circuits
The sub-menu options displayed under Circuits, refer the following figure:

NOTE: Add GmplsExcludeNodeConstraint and Remove GmplsExcludeNodeConstraint option will be displayed for the nodes with GMPLS license enabled.
Add GlobalExcludeNodeConstraint
Perform the following steps to add constraint on a node to restrict it from being used for circuit creation:
Perform the following steps to include a node (node which was excluded) for creating circuits. This option is displayed after Add GlobalExcludeNodeConstraint operation is performed on the node:
Add GmplsExcludeNodeConstraint
Perform the following steps to exclude a node such that node can be prevented from being used for creating GMPLS circuits:
Remove GmplsExcludeNodeConstraint
Perform the following steps to include a node (node which was excluded) for creating GMPLS circuits. This option is displayed after Add GlobalExcludeNodeConstraint operation is performed on the node:
View Circuits
Perform the following steps to view circuits that are created on a node:
Node Operations
The sub-menu options displayed under Node Operations are explained in the following figure:
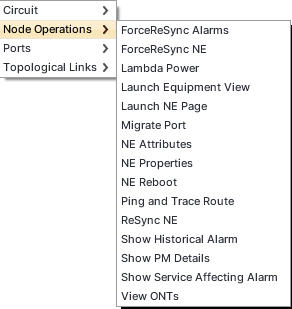
NOTE: View ONTs option is not supported for this release.
Force ReSync Alarms
ForceReSync Alarms option can be used to resolve the mismatch of alarms between TJ5500 and node.
Perform the following steps to force re-sync alarms on the selected node:
Force Resync Node
ForceReSync Node option can be used to resolve the mismatch of node configuration between TJ5500 and node.
Perform the following steps to force re-sync a node:
Lambda Power
Perform the following steps to provision lambda power or to view the provisioned Lambda power in Tabular or Graphical form:
NOTE: To provision or view the Lambda power, the user should be a common user of EMS and NMS.

a. Click Provision Lambda Power. The list of ports will be displayed in new window.
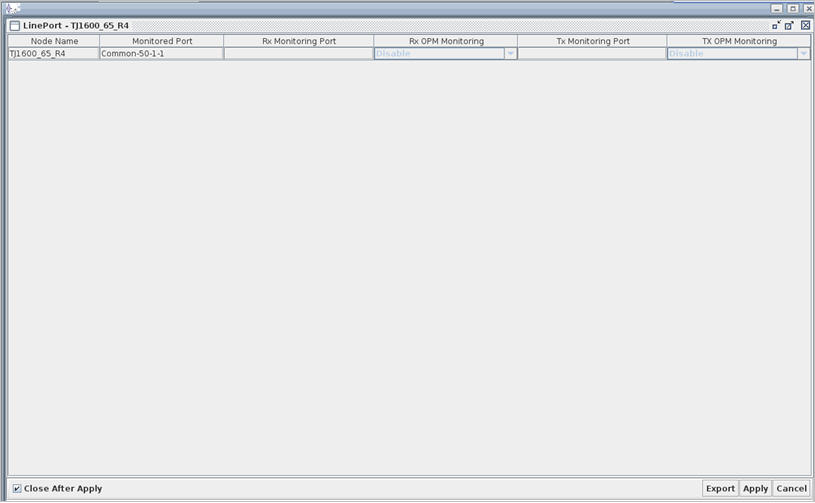
b. Select Enable or Disable for the parameters TX OPM Monitoring and RX OPM Monitoring.
c. Click Apply.
a. Click Tabular Lambda Power. Filter - Tabular_LambdaPower window is displayed.
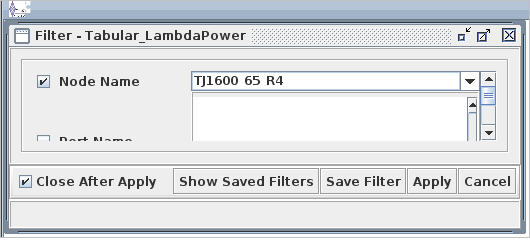
b. To display the saved filters, click Show Saved Filters.
c. To save the filter search, click Save Filter. Save Filter window appears. Enter a unique filter name in Filter Name text box.
d. Select the Node Name and Port Name and click Apply. Filter-Tabular Lambda Power window appears displaying filter results.
a. Click Graphical Lambda Power. Filter-Graphical Lambda Power window appears displaying filter results.
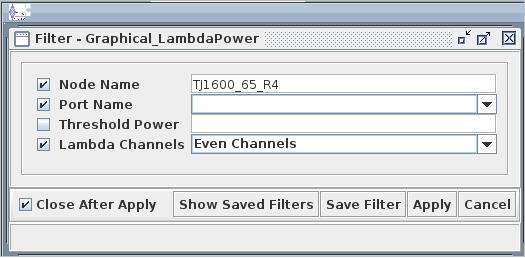
b. To display the saved filters, click Show Saved Filters.
c. To save the filter search, click Save Filter. Click Save Filter. Save Filter window appears. Enter a unique filter name in Filter Name text box.
d. Select the node name and the port name.
e. Select the check box against the field "Threshold Power" to enter the required value and click Apply. Lambda Power Bar Chart window appears displaying filter results.
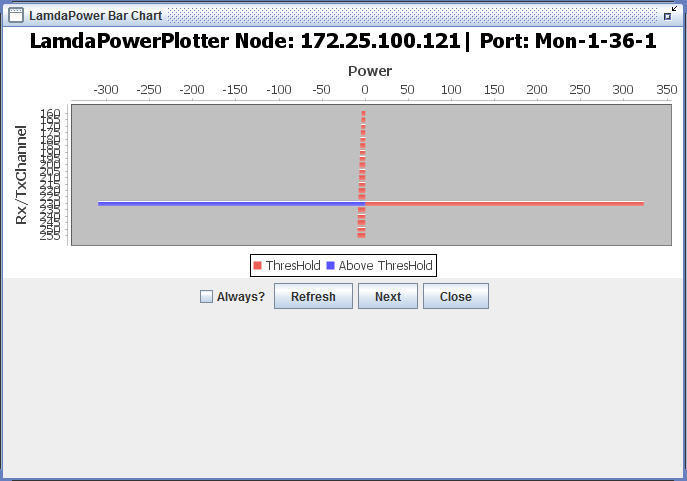
f. If you want the task "Refresh" to be performed all the time, then select the check box "Always".
g. Click Refresh to update the screen with any fresh entries.
h. Click Next to view the next set of entries if the number of entries has exceeded the permissible limit.
i. Click Close to exit the window.
Launch Equipment View
Perform the following steps to launch the equipment view of the selected node:
NOTE: Context based launch of EMS 'Launch Equipment View' will display result only for a common user of TJ5100 and TJ5500.
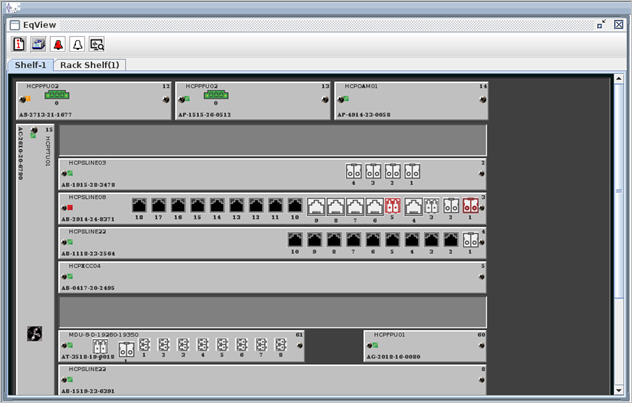
> To view the attributes of the selected object, select Attributes.
> To view the alarms of selected object, click Alarms > Current Alarms.../Historical Alarms... as desired.
Launch node page
Refer the topic Launch node page for procedure on how to launch the node page of the selected Node.
Migrate Port
Ports migration is supported at same port rate on same node (intra node port migration only). Before performing port migration, delete TL (if any) on that port (From Port) and create a new TL on the port (To Port).
NOTE: User can retry Port Migration if previous operation is terminated because of node getting unreachable in process, provided user has not used the new port for creating any new Cross-connect.
Perform the following steps to migrate the port rate on selected node:
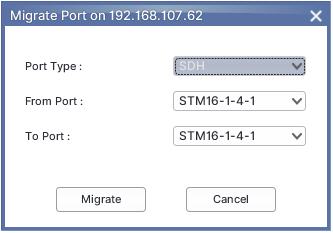
NOTE: Port Migration for PDH, VCG and DWDM ports are not supported.
View node attributes
Perform the following steps to view the node attributes:
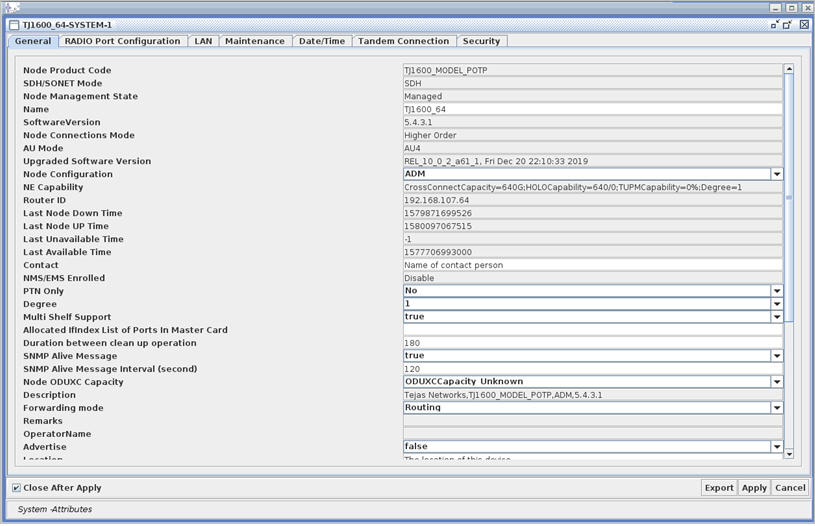
Node attributes
Parameter |
Description |
|---|---|
General |
|
Node Product Code |
Displays the product code of the node. |
SDH/SONET Mode |
Displays the type of node. |
Node Management Status |
Displays the node state. The Node management state can be either Managed state or UnManaged state. |
Name |
Displays the name of the node. Supports 40 character long host name. |
Software Version |
Displays the current software version. |
Node Connection Mode |
Displays Higher Order and Lower Order Mode. |
AU Mode |
Displays the AU mode. |
Node Configuration |
Displays the configuration of the node if it is an ADM or a regenerator. |
NE Capability |
Displays the capabilities of the node - Cross-connect, HO/LO, TUPM capability, and Degree. |
Router ID |
Displays the router ID of the node. |
Contact |
Displays the name of the person responsible for the node. |
NMS/EMS Enrolled |
The options are:
NOTE: This parameter value can be changed from TJ5100 license, if resource management from nms is disabled [RESOURCE_MGMT_BY_NMS=false]. |
PTN Only |
Allows you to enter whether this is PTN mode only or not. |
Degree |
Displays the degree. |
Multi-shelf Support |
Allows you to select the true or false value for this field. |
Allocated Ifindex List of Ports in Mastercard |
Displays IfIndex associated with the master port. |
Duration between Cleanup Operation |
Sets the duration in seconds for clean-up operation. |
SNMP alive message |
Displays the SNMP Alive message. |
SNMP alive interval (Second) |
Allows you to enter the time interval in terms of seconds at which SNMP Alive message will be sent. |
Description |
Displays brief description of the node |
Forwarding Mode |
Displays the type of forwarding mode. |
Remarks |
Displays the remarks mentioned about the node |
Advertise |
Displays whether the status is true or false. |
Location |
Displays the location name of the node. |
OperatorName |
Displays name of the operator |
DateAdded |
Displays the date and times when Node was added |
IsGNE |
The check box is ticked if the node is a gateway node. |
Offline |
If this field is selected, the node is offline. |
Partition |
Displays the name of the partition. |
Is DNI Capable |
Displays whether DNI is capable or not. |
Alarm Correlation Setting |
Allows you to set the alarm ON/OFF. |
AES Key EXchange Interval |
Select the required exchange interval from the list displayed. |
PassPhrase |
Enter the pass phrase. |
SD IF Combiner |
Select the SD IF Combiner from the list displayed. |
APS Thread Priority |
Select the default priority or high priority. |
IPV6 Status |
Displays the status of the IPv6 router. |
High Threshold |
This parameter is not supported for this release. |
NMS/EMS Reachability |
The options are:
|
RADIO Port Configuration |
|
AIS Activation Delay |
This parameter is valid when the delay in AIS activation happens. |
AIS Activation Condition |
This parameter is valid only when PDH chassis exists.
|
LAN |
|
Ethernet IP Address |
Displays the Ethernet IP of the node. |
MAC Address |
Displays the MAC Address of the node. |
EthernetIP Mask Length |
Displays the Masklength for Ethernet IP on the Node. |
Node IP Address |
Displays the IP address of the node. |
Node IP Mask Length |
Displays the mask length of the node that needs to be redistributed. |
Default Gateway |
IP Address of the Gateway machine. |
Global Routable Prefix |
Enter the global routable prefix. |
Ethernet IPv6 Address |
Enter the Ethernet IPv6 Address. |
Maintenance |
|
Crash Recovery Option |
This option enables the node to recover from crash due to corrupted software. |
Date/Time |
|
Time Server IP Address |
IP address of the NTP server from which the node is deriving the time. |
Timezone |
The time zone to be set on node. |
Secondary Timezone |
The secondary time zone to be set on node. |
Secondary Timezone enable |
Secondary Timezone is enabled/disabled. |
Set Time Format |
Set the format for the time. |
Tandem Connection |
|
TCM option |
TCM will enable the error monitoring at the network. |
Security |
|
RADIUS Authentication |
Radius Authentication can be enabled or disabled. |
Session Timeout (Minutes) |
Displays the session timeout. |
Maximum HTTP Sessions |
Displays the number of maximum sessions. |
Maximum Invalid Attempt Count |
Displays the number of maximum invalid attempt. |
Lockout Time (seconds) |
Displays the lockout time. |
RADIUS Cache Time Out (Minutes) |
Displays the cache time out. |
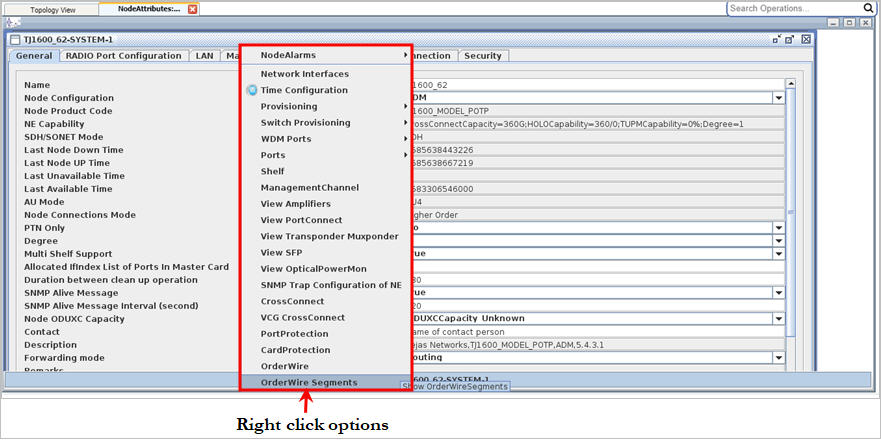
The right click options available on the Attributes window is shown in the following figure:
View Node Properties
Perform the following steps to view the information of a selected node:

The user can also copy the information on ME Properties window by selecting the desired attributes and pressing CTRL+C.
Node Reboot
The user can perform node reboot from the Topology View window. The reboot option includes service disruptive and service non-disruptive reboot.
Perform the following steps to reboot a node:
Perform Ping and Trace Route
Ping and Trace route option is supported only for a common user of EMS and NMS.
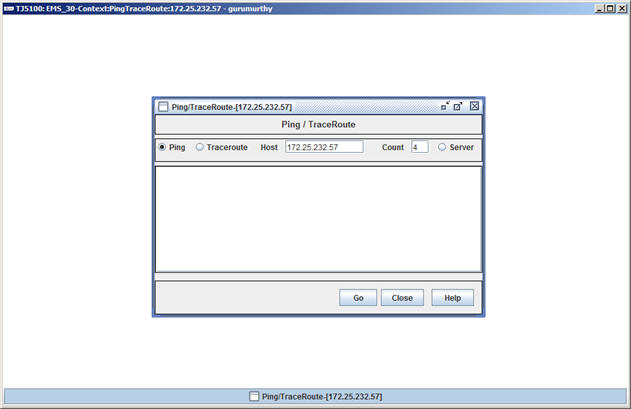
Ping test checks if a node or IP address is reachable across the internet by sending multiple Internet Control Message Protocol (ICMP) packets and listening for the replies. The Ping test measures the time taken by the packets to go from TJ5500 application to the selected node.
Trace route test will trace the route that test packets take from one node to another. The test results provide a list of hosts or IP addresses showing the route taken by the test packets starting from the selected monitoring node to the destination node. Common uses of the Traceroute test are network troubleshooting and to help identify routing problems or firewalls that may be blocking access to a node.
Perform the following steps to execute a ping or trace route test on the selected node:
ReSync Node
ReSync Node option can be used to resolve the mismatch of node data between TJ5500 and TJ5100.
Perform the following steps to re-sync a node:
View Historical Alarms
Refer the topic View Historical alarms for procedure on how to view historical alarms on the selected node.
View Performance Monitoring Page
Perform the following steps to view the performance monitoring parameters of the selected node:
NOTE: Context based launch of EMS will display result only for a common user of TJ5100 and TJ5500.
 . Context:PMDetails:<IP_address> based window of the TJ5100 is launched.
Repeat step 4 and 5 to add more nodes, if required.
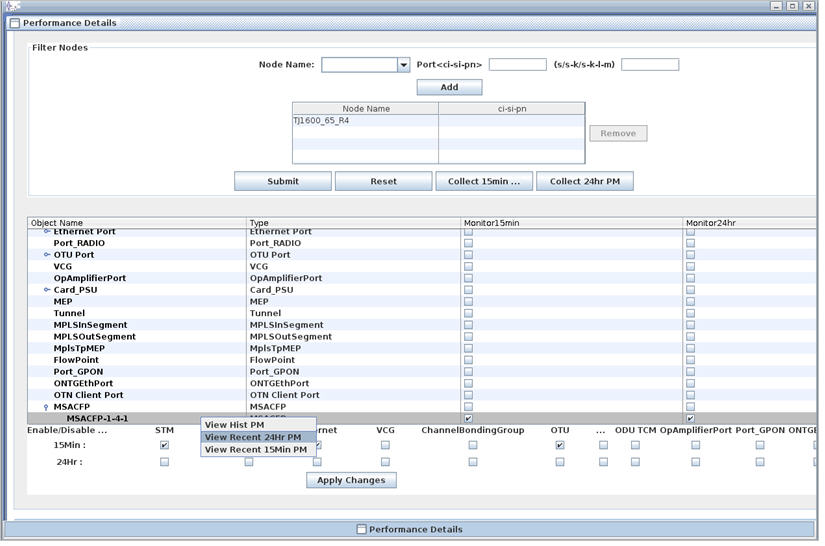
Performance Details of MSACFP port is displayed as shown in following figure:
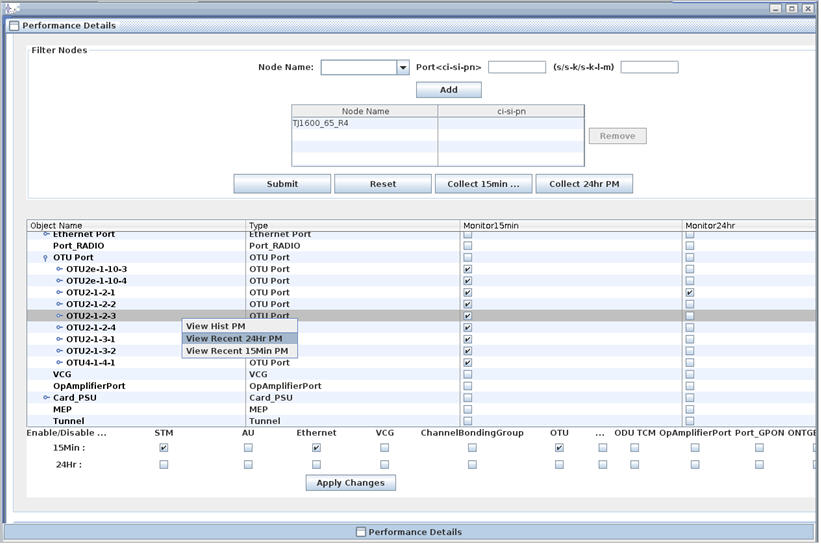
Performance Details of OTU4 port is displayed as shown in following figure:
CFP Performance Parameters
Parameter |
Description |
|---|---|
Received Power |
Displays the power received per lane on the CFP module. |
Rx Laser Temperature |
Displays the temperature of the laser received per lane on the CFP module. |
Average OSNR |
Displays the average optical signal-to-noise ratio value per lane on the CFP module. |
FecCorr |
Displays the count of corrected bits. |
Average ESNR |
Displays the average electrical signal-to-noise ratio value per lane on the CFP module. |
Chromatic Dispersion |
Displays the average chromatic dispersion value per lane on the CFP module. |
Tx Laser Temperature |
Displays the temperature of the laser transmitted per lane on the CFP module. |
Interval Valid |
Displays the validity of the interval as 1 or 0. '1' is displayed when none of the below mentioned operations occur at that interval on the port. '0' is displayed if any of the below mentioned operations occur at that interval on the port. The operations are:
|
Average QFactor |
Displays the average Q-factor value per lane on the CFP module. |
Tx Laser Bias Current |
Displays the laser bias current transmitted per lane on the CFP module. |
Module Temp |
Displays the temperature of the CFP module in terms of degree Celsius. |
Rx Laser Bias Current |
Displays the laser bias current received per lane on the CFP module. |
FecBlkCount |
Displays the count of FEC block counts which is a summation of FecCorr and FecUnCorr values. |
FecUnCorr |
Displays the count of errors present in the frame before being processed or corrected by FEC. The value is in terms of blocks where each block consists of 8 bits. |
Transmit Power |
Displays the power transmitted per lane on the CFP module. |
Average PMD |
Displays the average polarization mode dispersion value per lane on the CFP module. |
OTU Performance Parameters supported at Node level
Parameter |
Description |
|---|---|
Interval Valid |
Displays the valid interval. |
SESR |
Displays the severely errored seconds ratio. |
Fec1to0 |
The Forward Error Correction 0 to 1. |
BIAE |
The backward incoming alignment error count on OTU. |
FecR-S |
The Forward Error Correction Seconds Ratio. |
Fec1to0-S |
The Forward Error Correction Section 0 to 1. |
IAE |
The incoming alignment error count on OTU. |
SES |
The severely errored second OTU. |
FecPre-S |
The Previous Section Forward Error Correction. |
Section Interval Valid |
Interval Valid is the validity of the interval and the validity of data during that interval. |
ES_FE |
The errored seconds at far end count on OTU. |
FecPost |
The Post Forward Error Correction. |
BBE |
The background block errors count on OTU. |
UAS |
The unavailable second count on OTU. |
FecCorrBit |
Displays number of corrected bits in the frame. |
ES |
Displays the errored second count on OTU. |
FE Interval Valid |
Displays the validity of data during that interval at far end in OTU. 1 indicates the data displayed during that interval is valid, while 0 indicates the data is not valid. |
FecPost-S |
The Post Forward Error Correction Section. |
Fec0to1 |
The Forward Error Correction 1 to 0. |
FecTotalR |
The Forward Error Correction Total value. |
SES_FE |
The severely errored seconds at far end count on OTU. |
Fec0to1-S |
The Forward Error Correction Section 1 to 0. |
BBER |
The background block error ratio. |
FecPre |
The Previous Forward Error Correction. |
EB |
The errored blocks count on OTU. |
BBE_FE |
The background blocked errors at far end count on OTU. |
FEC |
The Forward error correction. |
UAS_FE |
The unavailable seconds at far end count on OTU. |
FecTotal-S |
The Forward Error Correction Seconds Total value. |
FecUncorrBlk |
Displays number of uncorrected bits in the frame. |
ESR |
The errored seconds ratio. |
PreFecBER |
The previous forward error correction block error ratio. |
StartTime |
Displays the start time. |
EndTime |
Displays the end time. |
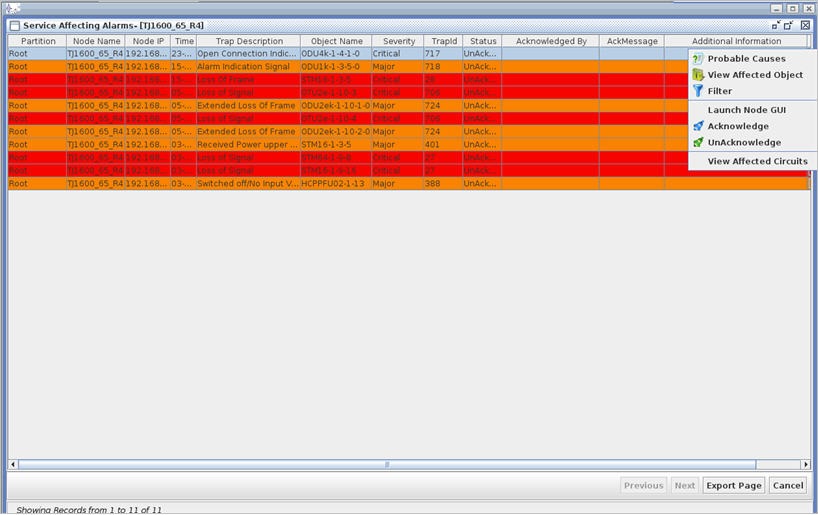
View Service Affecting Alarms
Perform the following steps to view the service affecting alarms on the selected node:
 (View Service Affecting Alarms). Context:ServiceAffectingAlarm:<IP_address> based window of the TJ5100 is launched.
View ONTs
Perform the following steps to view the ONTs connected to the GPON node:
For more details on Manage ONTs page, refer Manage ONTs.
Ports
The sub-menu option displayed under Ports is explained as follows:

Manage L1 Ports
Manage L1 Ports option allows you to perform DWDM and OTN Port configurations like ODU channelization, TCM settings, and add/drop port configuration on cards in OTN mode for the selected node through Topology View.
Perform the following steps to display the Manage L1 Ports page for selected node:
Topological Links
The sub menu options displayed under Topological Links are explained as follows:
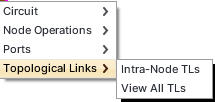
View Intra Node TLs
Perform the following steps to view the intra node topological links:

View All TLs
Perform the following steps to view all the topological links present on the node: