Previous Topic

Next Topic

Book Contents

View Historical alarms

The TJ5100 maintains a history of the alarms that were raised in the network as historical alarms. User can view these alarms at node/VNE/switch level on Network View (Nodes) and Network View (Switches) tab on Topology View window.

Perform the following steps to view the historical alarms:
  1. Go to Topology menu and click Topology View option. Topology View window is launched.
  2. Click Network View (Nodes) / Network View (Switches) tab and select the desired partition.
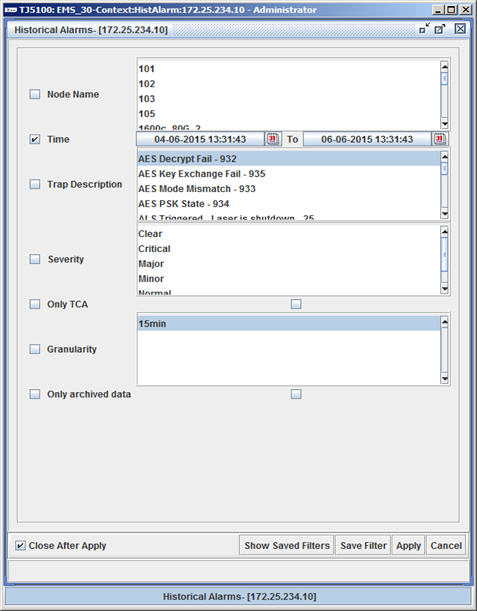
  3. Select the desired node/VNE/switch and select from Alarms/PM tab. Context:HistAlarm:<IP_address> based window is launched.

    Historical Alarms Window

  4. Select the check box against the desired filtering criteria and the corresponding options from the list.
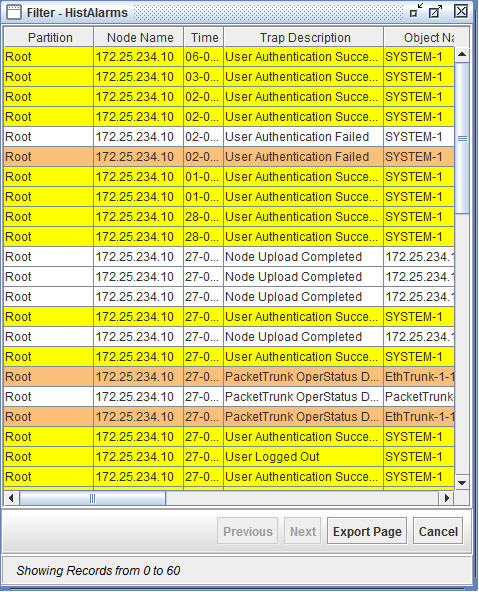
  5. Click Apply. Filter result is displayed in Filter - HistAlarms window as shown in the following figure:

    Filter - HistAlarms window

Historical Alarms parameters

Parameter

Description

Node Name

Click the check box and select the desired nodes from the list.

Time

Allows you to set the time duration in order to filter the alarms based on time at which it was reported. This parameter is selected by default and if not set, will display historical alarms of default time range.

Trap Description

Click the check box and select the description on the cause of the alarm. If not selected, it will display historical alarms of all supported trap IDs by default.

Severity

Click the check box and select the desired severity from the list.

Only TCA

Click the check box to enable or disable TCA.

Granularity

Click the check box and select the granularity based on which search will be performed.

Only archived data

Click the check box and select the check box again to enable the parameter. The historical alarms will be searched from archived data only when enabled.

Close After Apply

Select the check box to automatically close the 'Historical Alarms' window after the search result is displayed.

Show Saved Filters

Click to view and apply saved filters, if any.

Save Filter

Click to save the filtering criteria by a filter name.

Apply

Click to search and view alarms based on the criteria selected.

Cancel

Click to close the window without performing any operation.

You can also save the filtering criteria, do the following steps:

  1. On Context:HistAlarm:<IP_address> window, select the check box against the desired parameters and click the required options.
  2. Click Save Filters. The Save Filter window is displayed.
  3. Enter the Filter Name in the text box provided and select the user type from Available To drop-down menu.
  4. Click Apply. Message window appears. Click OK.
  5. Click View Saved Filters to view the saved filtering criteria.

See also

Topology View

Understand Network View (Nodes) tab

Understand Network View (Switches) tab

Open parent partition

Create Topological Link

Delete Topological Links

Toggle TL view

Create circuits from Topology View menu

View circuits or Tunnels/Pseudowire/Services/SRLG

Set Span Loss parameters

Span Loss report generation

Assign SRLG ID to TLs from Topology View

Create VPLS Cloud link

Create Open ERP over VPLS Cloud

Generate bandwidth utilization report of packet trunks

Enable and disable PM

View alarms at Partition/Node/Topological link level

View alarms on Amplifiers

View bandwidth utilization on Topology View

Node Augmentation

Augment Node_Ethernet

Remove node from Topology

Re-Augment a node

Create new Third Party Cloud

Management view of EMS

Node administration view of EMS

NE software upgrade

Save Topology

Resync EMS

View optical power reports of selected node(s) or TL(s)

Live monitoring of optical power, Lambda power, and Performance

Monitor alarms

Upload background image

Launch node page

View PM details

View EMS level report

Create services from Topology View menu

Create Tunnel from Topology View menu