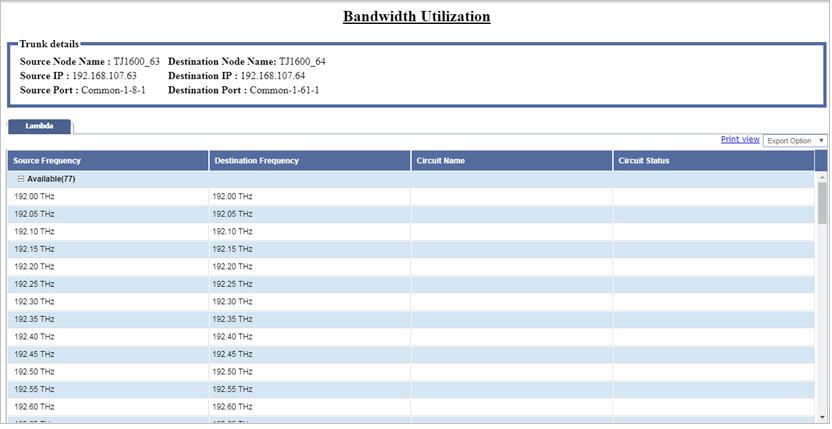
Perform the following steps to view the bandwidth utilization of a trunk/packet trunk:
In case of aggregated link, double-click the link between two nodes and then select the desired TL.
The Bandwidth Utilization window is displayed with the trunk details and the available time slots.

Refer to the topic View bandwidth utilization for description of parameters and options available on Bandwidth Utilization window for the selected trunk.
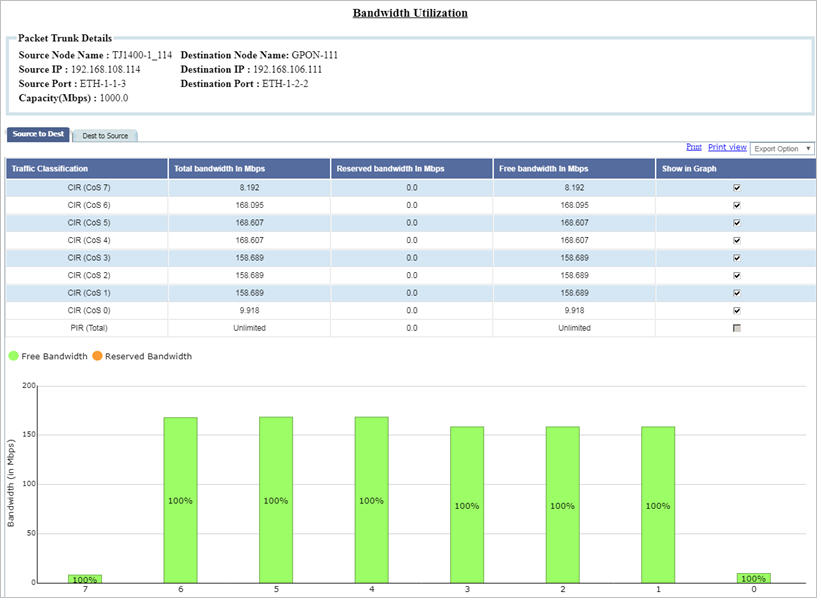
Following figure displays the Bandwidth Utilization window when a packet trunk is selected:

Bandwidth Utilization parameters- Packet Trunk
Parameter |
Description |
|---|---|
Packet Trunk Details |
|
Source Node Name |
Displays the name of the source node. |
Destination Node Name |
Displays the name of the destination node. |
Source IP |
Displays the IP address of the source node. |
Destination IP |
Displays the IP address of the destination node. |
Source Port |
Displays the name of the source port. |
Destination Port |
Displays the name of the destination port. |
Capacity(Mbps) |
Displays the capacity of the selected packet trunk. |
Source to Dest/ Dest to Source |
|
Traffic Classification |
Displays the bandwidth value (CIR and PIR) for the desired queues (Queue 7 to Queue 1). |
Total bandwidth In Mbps |
Displays the total bandwidth value in mbps for each queue. |
Reserved bandwidth In Mbps |
Displays the reserved bandwidth value in mbps for the corresponding CoS queue. Reserved bandwidth value in percentage is plotted in orange color in the graph. |
Free bandwidth In Mbps |
Displays the available bandwidth value in mbps for the corresponding CoS queue. Free bandwidth value in percentage is plotted in green color in the graph. |
Show in graph |
Select/unselect the check box against the CoS queue value in order to plot those CoS value in graph form. |
Print view |
Click the link to display the bandwidth utilization table in a printable format. |
Export Option |
Click the drop down and select the desired format from the options namely Export to PDF, Export to XML, or Export to CSV to generate a report of the bandwidth utilization in that format. |