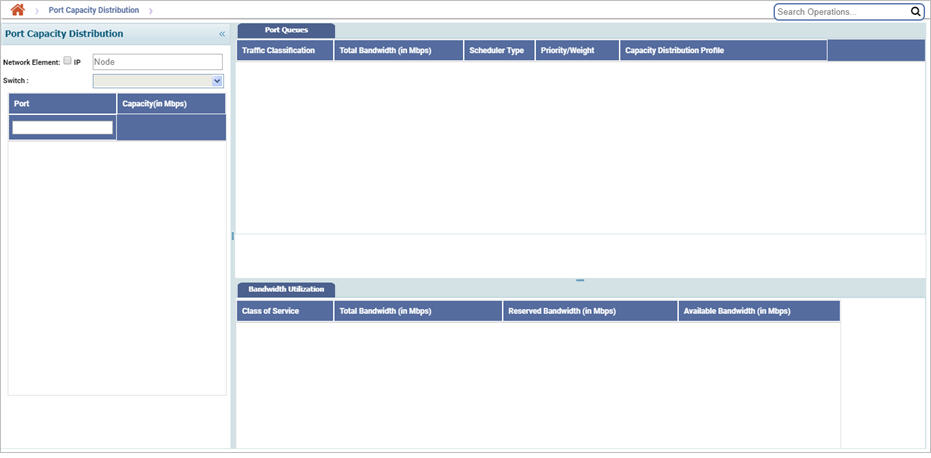
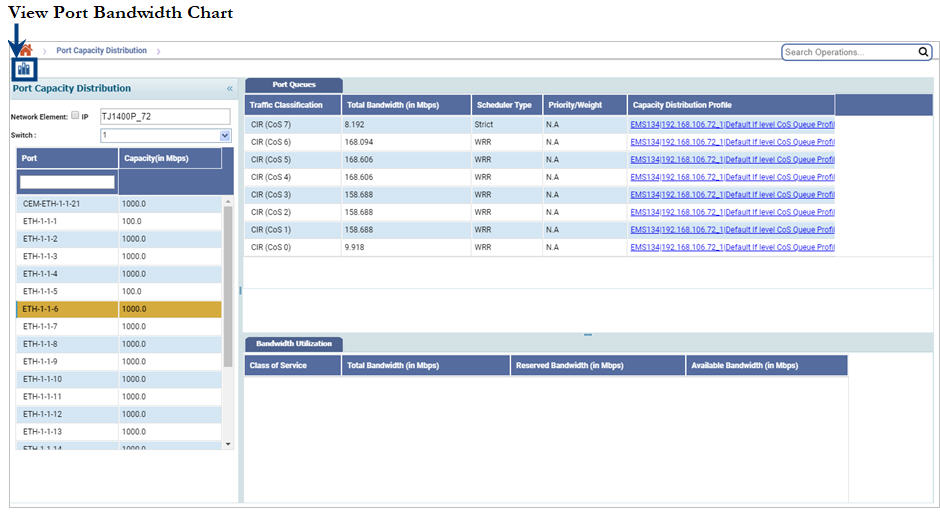
Port Capacity Distribution menu options allows the user to view the bandwidth utilization of node port at CoS level. The user can also view the Capacity Distribution Profile associated with a particular port. It also provides a bandwidth utilization chart to help the user before any provisioning.
Perform the following steps to view the port capacity distribution of a Node:

A list of Port on the node and the corresponding Capacity(in Mbps) is displayed.
To view the bandwidth utilization of a Class of Service, click the desired CoS value under Port Queues. The total, reserved, and available bandwidth in Mbps on that CoS will be displayed under Bandwidth Utilization tab as shown in the figure.

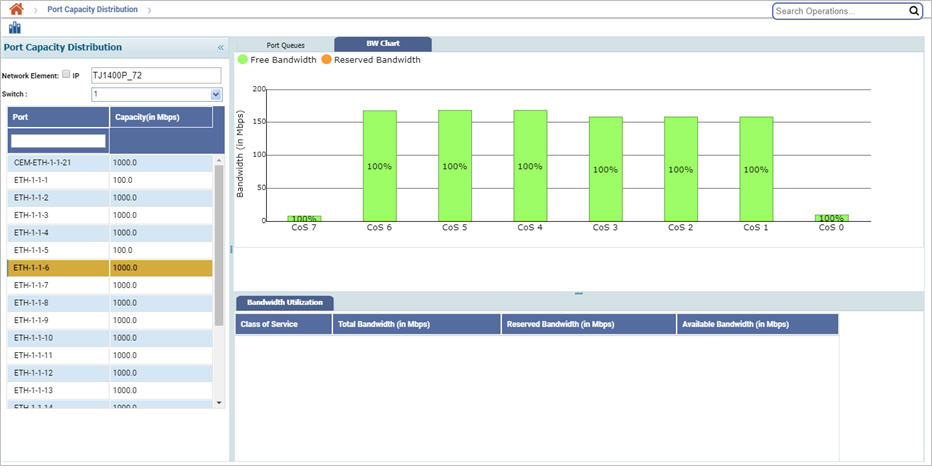
To view the bandwidth utilization of a port in form of chart, click the desired port on the node and click ![]() (View Port Bandwidth Chart). The free (green color) and reserved bandwidth (orange color) on that port will be displayed under BW Chart tab as shown in the following figure:
(View Port Bandwidth Chart). The free (green color) and reserved bandwidth (orange color) on that port will be displayed under BW Chart tab as shown in the following figure:
