This widget gives the information of the history of all the alarms generated. By default it displays only today’s event (i.e., from 12.00 AM to current time). Alarms are distinguished into Critical (Red), Major (Orange), Minor (Light Orange) and Normal (Green) based on the severity level.
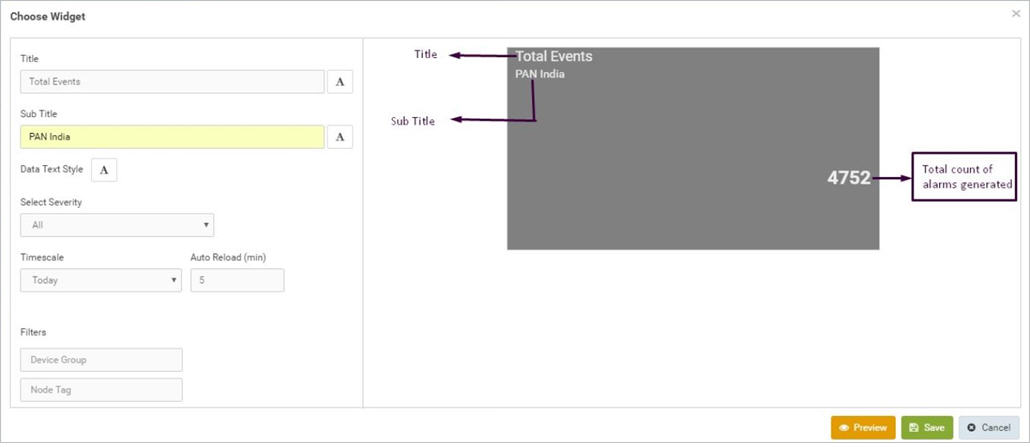
Title – Type the desired title to be displayed on the panel (Labeling of the panel).
Sub Title – Type the desired sub title to be displayed on the panel.
Data Text Type – Click on A to edit the font and size of text to be displayed on the panel.
Select Severity – Select the type of severity of alarms to be displayed on the panel from the drop down box.
Time Scale - Select the desired timescale from the dropdown list to be summarized and display the status (Time scale is specific for this particular widget).
Auto Reload - Select the desired auto reloading time of the widget (in minutes).
Click on the particular Host Name or Resource Name to get the detailed information.