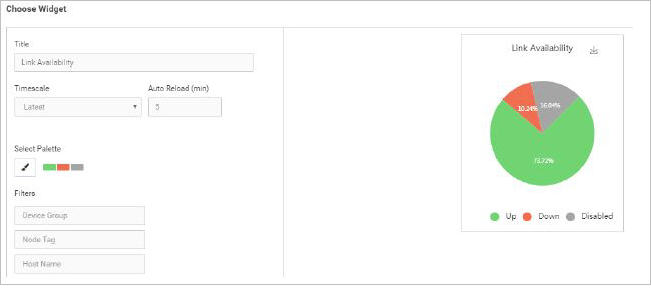
This widget helps to view the status of all the links/interfaces for selected time interval and display the percentage statistics in a pie graph. It shows the information about the percentage of Up, Down and Disabled links/interfaces.
Select the required widget from the column and click on Add.
Title – Type the desired title to be displayed on top of the widget (Labeling of thewidget).
Timescale – Select the desired timescale from the dropdown list, to be summarized and display the status (Time scale is specific for this particular widget).
Auto Reload – Select the desired auto reloading time of the widget (in minutes).
Select Palette – Select the color format from a range of available formats to display the Up, Down and Disabled Links.