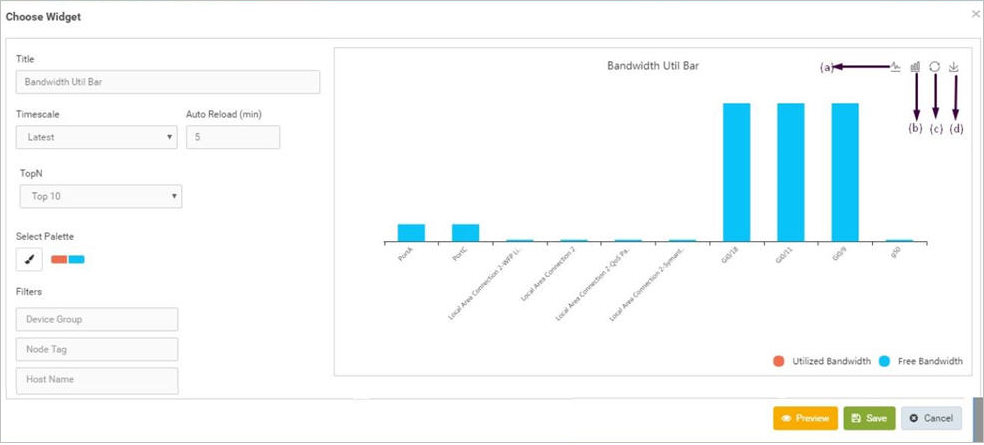
This widget gives the information of bandwidth utilization of individual interfaces/links in a Stack Bar graph. It displays the information of Utilized Bandwidth and Free Bandwidth of each and every interface/link.
Title - Type the desired title to be displayed on top of the widget (Labeling of thewidget).
Timescale – Select the desired timescale from the dropdown list to be summarized and display the status (Time scale is specific for this particular widget).
Auto Reload – Select the desired auto reloading time of the widget (in minutes).
TopN – Select the desired number of interfaces/links to be displayed on the graph.
Select Palette – Select the color format from a range of available formats to display the Utilized Bandwidth and Free Bandwidth.