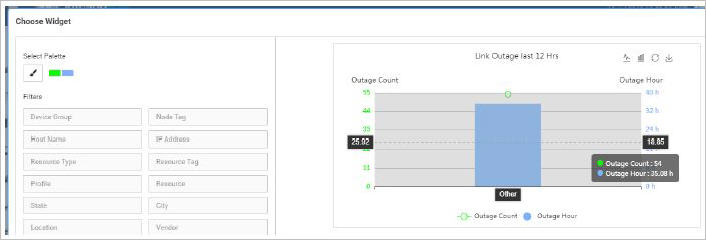
This widget gives the information of the count of down links/interfaces and total numbers of hours links/interfaces are down. The information is displayed as per States operating the devices.
NOTE: Information is mapped for last 12 hours.
Title – Type the desired title to be displayed on the panel (Labeling of the panel).
Auto Reload - Select the desired auto reloading time of the widget (in minutes).
Select Palette-Click to select a color palette for the widget, from a range of available colour combinations.
Click on to see the line chart view.
Click on to see the bar chart form.
Click on to reload graph/ information manually at that particular instance.
Click on to download the particular graph.
displays the color format of Outrage Count and Outrage Hour.
displays the number of times the device is down.
displays the total number hours the device is down.