Horizontal Side by Side Bar Chart
This widget gives the averaged out information of selected statistic in a Horizontal side-by-side Bar Chart View.
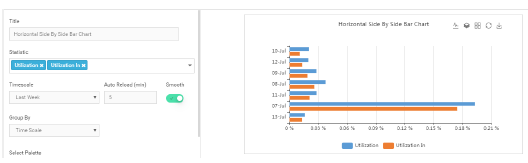
- Title– Type the desired title to be displayed on the panel (Label of the panel).
- Statistic –Select statistic(s) using the dropdown menu.This widget allows selection of multiple statistics.
- Time Scale- Select the desired timescale using the dropdown menu. The data for the selected timescale will be summarized and displayed.
- Auto Reload- Select Auto Reload time of the widget (in minutes).
- Smooth – Use to toggle view smooth/sharpened edges.
- Group By – Using the dropdown menu, select the category for grouping the statistics, on the ‘X’ axis.
- Select Palette– Click
 to select a color palette for the widget, from a range of available colour combinations.
 - Filters– Select filters, as applicable.
- Click on
 to display the bar chart view.
 - Click on
 to display the stack view when multiple stats are selected.
 - Click on
 to display the side by side view when multiple stats are selected.
 - Click on
 to reload the graph/information at that particular instant.
 - Click
 to download the graph to the desktop.
Mouse over on the graph to view additional information.