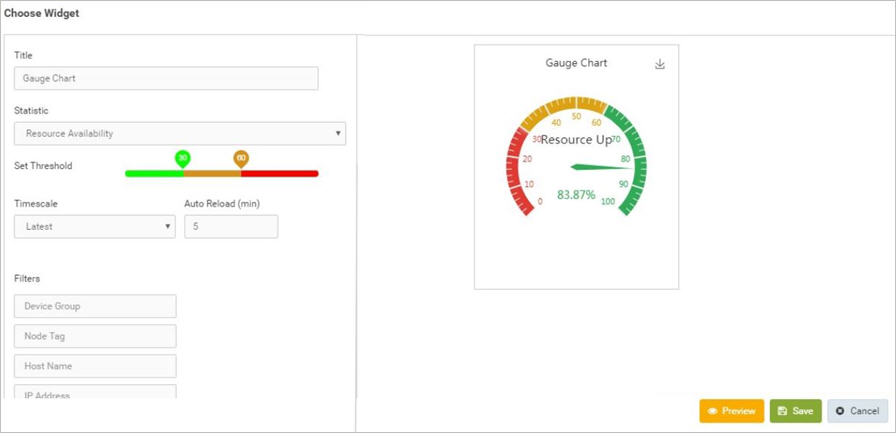
This widget gives the averaged out information of all the resources in the device based on selected statistic in Gauge View. Only one stat can be selected and viewed at a time. Stats which can be mapped between 0% - 100% must be selected.
Title – Type the desired title to be displayed on the panel (Labeling of the panel).
Statistic – Select the desired statistic whose information needs to be displayed.
Set Threshold - This option allows to set the upper and lower limits of the percentage of selected statistic to be displayed.
Time Scale - Select the desired timescale from the dropdown list to be summarized and display the status (Time scale is specific for this particular widget).
Auto Reload - Select the desired auto reloading time of the widget (in minutes).
Select Palette– Click to select a color palette for the widget, from a range of available colour combinations.