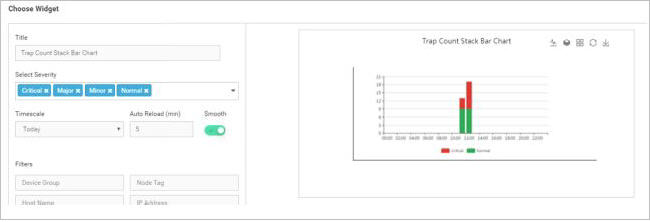
This widget displays the detailed information of active alarm count in a stack bar chart based on selected time scale.
Title – Type the desired title to be displayed on the panel (Labeling of the panel).
Select Severity – Select the severity of the alarms to be displayed among Critical, Major and Minor from the drop down list.
Time Scale - Select the desired timescale from the dropdown list to be summarized and display the status (Time scale is specific for this particular widget).
Auto Reload - Select the desired auto reloading time of the widget (in minutes).
Smooth – Click on to toggle view smooth/sharpen edges.
Filters– Select filters, as applicable.
Click on to display the bar chart view.
Click onto display the stack view when multiple stats are selected.
Click on to display the side by side view when multiple stats are selected.
Click onto reload the graph/information at that particular instant.
Click to download the graph to the desktop.
Mouse over on the graph to view additional information.