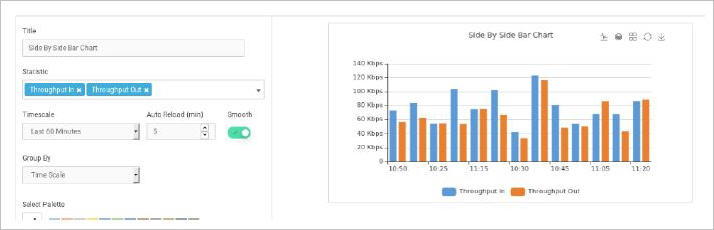
This widget gives the averaged out information of selected statistic in a side-by side Bar Chart View.
Title – Type the desired title to be displayed on the panel (Labeling of the panel).
Statistic – Select the statistic[s] using dropdown menu. By default, 'Utilization and Network Availability' are selected. Multiple statistic selection is allowed.
Time Scale - Select the desired timescale from the dropdown list to be summarized and display the status (Time scale is specific for this particular widget).
Auto Reload - Select the desired auto reloading time of the widget (in minutes).
Smooth – Click on to toggle view smooth/sharpen edges.
Group By – Using the dropdown menu, select the category for grouping the statistics, on the ‘X’ axis.
Select Palette– Click to select a color palette for the widget, from a range of available colour combinations.
Filters– Select filters, as applicable.
Click on to display the bar chart view.
Click onto display the stack view when multiple stats are selected.
Click on to display the side by side view when multiple stats are selected.
Click onto reload the graph/information at that particular instant.
Click to download the graph to the desktop.
Mouse over on the graph to view additional information.