Topology View
This widget displays the interconnections between devices, interfaces and servers, as a diagram.
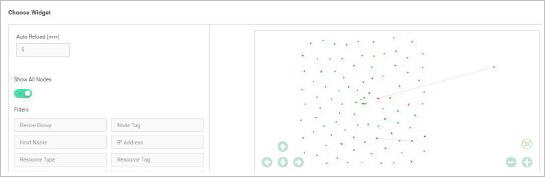
- Auto Reload– Select Auto Reload time of the widget (in minutes).
- Filters – Select filters, as applicable.
- The dots on the image depict devices. Zoom through the Topology diagram to see device details(Refer below image).
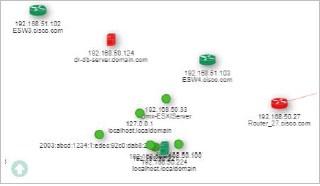
- The colours on the diagram indicate whether the device is Up, Down or Disabled (Green for UP, Red for Down and Grey for Disabled devices).
- Arrows and Zoom icon can be used to navigate through the topology diagram.
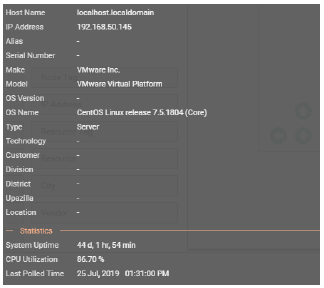
- Mouse over on a device to view additional information (refer below image).
- Mouse over to view the information of particular device, interface or server.