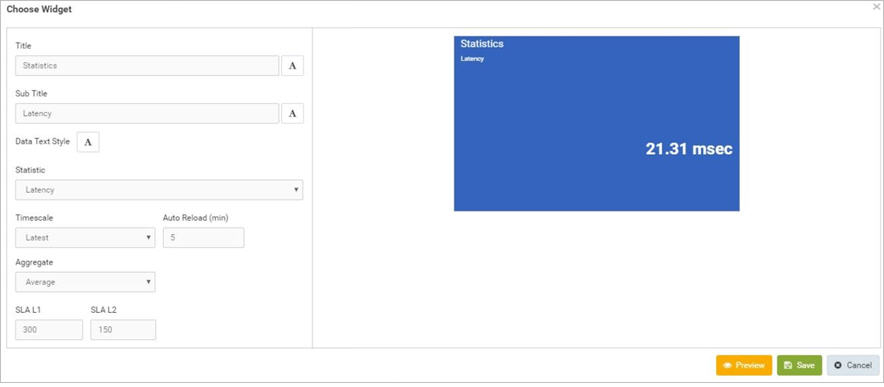
This widget displays the information of selected statistics of all the devices monitoring based on the selected aggregate value.
Title – Type the desired title to be displayed on the panel (Labeling of the panel).
Sub Title – Type the desired sub title to be displayed on the panel.
Data Text Type – Click on A to edit the font and size of text to be displayed on the panel.
Statistic – Select the desired statistic whose information need to be viewed.
Time Scale - Select the desired timescale from the dropdown list to be summarized and display the status (Time scale is specific for this particular widget).
Auto Reload - Select the desired auto reloading time of the widget (in minutes).
Aggregate – Select the operation from drop down list to perform based on the statistic selected.
SLA L1 – Select a upper limit to be display the breach of the particular statistic on the panel.
SLA L2 – Select a lower limit level to display the breach of the particular statistic on the panel.