Event Count Line Chart
This widget displays the count of events (based on the severity), in a Line Chart View.
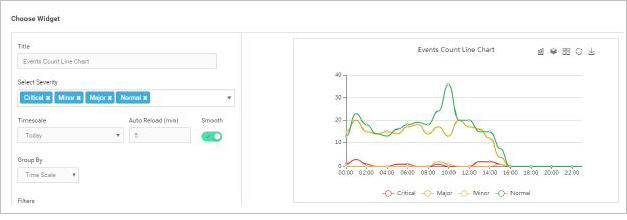
- Title – Type the desired title to be displayed on the panel (Labeling of the panel).
- Select Severity – Select the severity of the events to be displayed among Critical, Major, Minor and Normal from the drop down list.
- Time Scale - Select the desired timescale using the dropdown menu. The data for the selected timescale will be summarized and displayed.
- Auto Reload - Select the desired auto reloading time of the widget (in minutes).
- Smooth – Click on
 to toggle view smooth/sharpen edges.
 - Group By – Using the dropdown menu, select the category for grouping the statistics, on the ‘X’ axis.
- Filters– Select filters, as applicable.
- Click on
 to display the bar chart view.
 - Click on
 to display the stack view when multiple stats are selected.
 - Click on
 to display the side by side view when multiple stats are selected.
 - Click on
 to reload the graph/information at that particular instant.
 - Click
 to download the graph to the desktop.
Mouse over on the graph to view additional information.