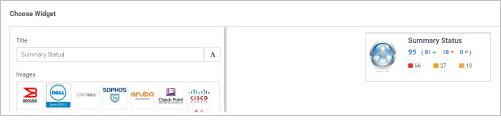
This widget gives the latest summary of the nodes/devices specific to particular vendor. It displays the information of total devices/nodes, Count of UP DOWN and DISABLED devices.
Severity of the alarms is represented by colors.Severity of the alarm is represented by colors.By default, they are Critical (Red), Major (Orange), Minor (Light Orange) and Normal (Green) based on the severity level.
Title – Type the desired title to be displayed on the panel (Labeling of the panel).
Image – Select the image/logo of desired vendor to view the latest status.
Auto Reload - Select the desired auto reloading time of the widget (in minutes).
Select Palette– Click to select a color palette for the widget, from a range of available colour combinations to display Up,Down and Disabled Links.
Filters – Select filters, as applicable.
The number before gives the count of nodes that are up.
The number before gives the count of nodes that are down.
The number before gives the count of nodes that are disabled.
The number before gives the count of Critical Alarms.
The number before gives the count of Major Alarms.
The number before gives the count of Minor Alarms.
Note: Click on the numbers to view additional details.