User can select multiple services and enable/disable or view Performance Management. Values for the parameters PM State and Granularity gets updated on Manage Services page on enabling the PM for selected service(s).
Enable PM
NOTE: Enabling and viewing Performance Management options is applicable to service in 'active state' only.
Perform the following steps to enable Performance Management on the selected service(s):
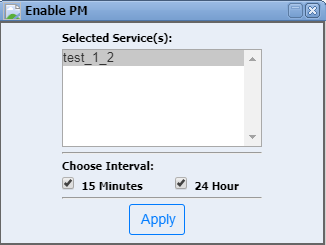
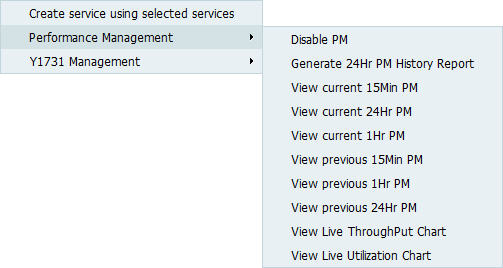
The performance management options for the services are as follows:
Disable PM
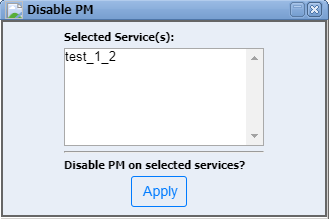
By default, the PM option is disabled. Perform the following steps to disable Performance Management on PM enabled service(s):
Generate 24Hr PM History Report
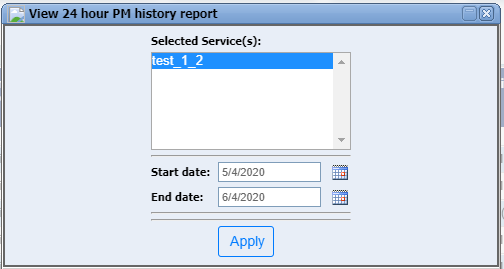
Perform the following steps to generate a 24Hr PM History report:
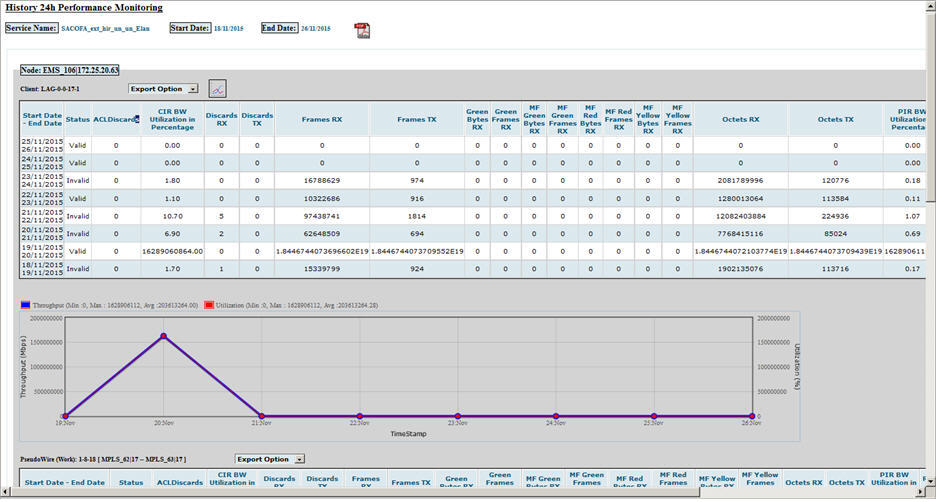
To save all tables in the report in PDF format, click ![]() (Export All tables To PDF) icon; or
(Export All tables To PDF) icon; or
To save individual tables in the report, select the desired format from the Export Option drop down menu against that table.
To view 24 hour PM history data in form of graph, click ![]() (View Graph of PM Parameters). Graph will be displayed as shown in the following figure:
(View Graph of PM Parameters). Graph will be displayed as shown in the following figure:
View current 15Min/1Hr/24Hr PM
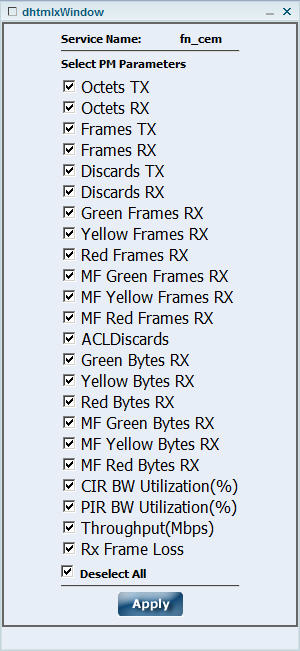
Perform the following steps to generate the current 15Min/1Hr/24Hr PM report:
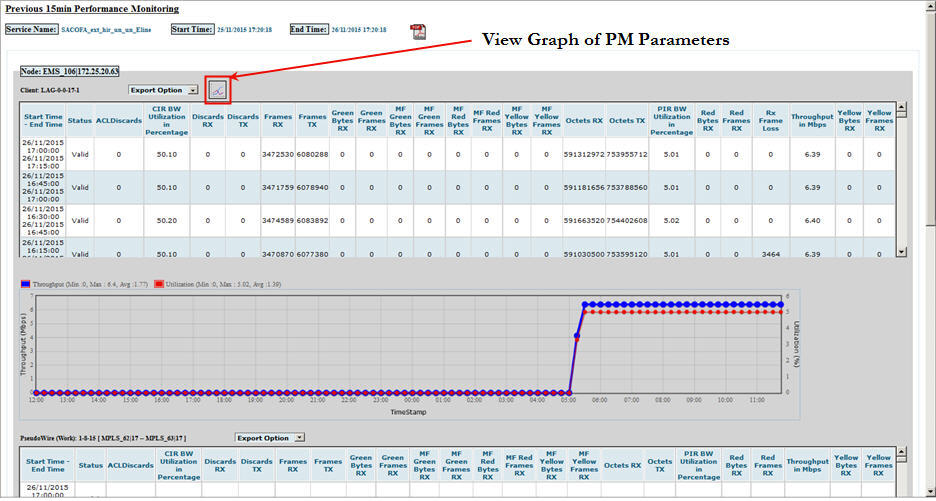
To save all tables in the report in PDF format, click ![]() (Export All tables To PDF) icon; or
(Export All tables To PDF) icon; or
To save individual tables in the report, select the desired format (PDF, CSV, XML and HTML) from the Export Option drop down menu against that table.
View previous 15Min/1Hr/24Hr PM
Perform the following steps to generate the previous 15Min/1Hr/24Hr PM report:

To save all tables in the report in PDF format, click ![]() (Export All tables To PDF) icon; or
(Export All tables To PDF) icon; or
To save individual tables in the report, select the desired format (PDF, CSV, XML and HTML) from the Export Option drop down menu against that table.
To view the data of a table for previous 15Mins interval in form of graph, click ![]() (View Graph of PM Parameters). Graph will be displayed with Throughput (Mbps) and Utilization (%) plotted against the time.
(View Graph of PM Parameters). Graph will be displayed with Throughput (Mbps) and Utilization (%) plotted against the time.
Performance Data
Parameter |
Description |
|---|---|
Current 15Min/1Hr/24Hr and Previous 15Min/1Hr/24Hr PM data |
|
Octets Tx |
Displays the count of number of octets transmitted. |
Octets Rx |
Displays the count of number of octets received. |
Frames Tx |
Displays the count of number of frames transmitted. |
Frames Rx |
Displays the count of number of frames received. |
Discards Tx |
Displays the count of number of transmit frames discarded. |
Discards Rx |
Displays the count of number of received frames discarded. |
Green Frames Rx |
Displays the count of number of green frames received. |
Yellow Frames Rx |
Displays the count of number of yellow frames received. |
Red Frames Rx |
Displays the count of number of red frames received. |
MF Green Frames Rx |
Displays the count of number of green frames received by the microflows. |
MF Yellow Frames Rx |
Displays the count of number of yellow frames received by the microflows. |
MF Red Frames Rx |
Displays the count of number of red frames received by the microflows. |
ACLDiscards |
Displays the count of number of packets dropped due to defined rules in ACL. |
Green Bytes Rx |
Displays the count of number of green bytes received. |
Yellow Bytes Rx |
Displays the count of number of yellow bytes received. |
Red Bytes Rx |
Displays the count of number of red bytes received. |
MF Green Bytes Rx |
Displays the count of number of green bytes received by the microflows. |
MF Yellow Bytes Rx |
Displays the count of number of yellow bytes received by the microflows. |
MF Red Bytes Rx |
Displays the count of number of red bytes received by the microflows. |
CIR BW Utilization(%) |
Select to display the CIR bandwidth utilization value in percentage. |
PIR BW Utilization(%) |
Select to display the PIR bandwidth utilization value in percentage. |
Throughput(Mbps) |
Select to display the data rate in Mbps. |
Rx Frame Loss |
Displays the count number of frame loss received. |
Deselect/Select All |
Allows you to click and de-select/select all PM parameters. |
NOTE 1: Use EMS to access the radio performance monitoring parameters.
NOTE 2: The steps to View current 15Min/1Hr/24Hr PM and previous 15Min/1Hr/24Hr PM are same.
View Live Throughput and Utilization Chart
Perform the following steps to view live throughput and utilization of the selected service:
NOTE: Live Throughput and Live Utilization can be viewed only if 24 Hour PM is enabled on the service.
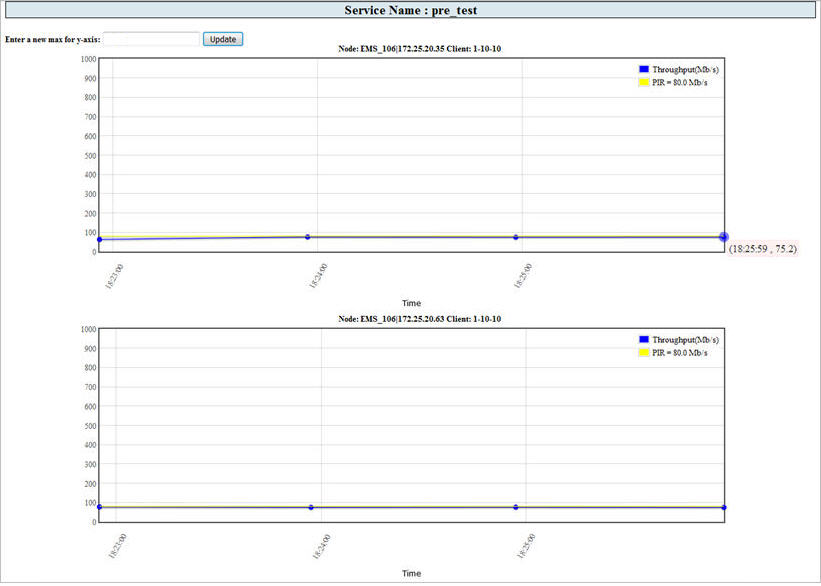
Two graphs indicates two end points of the service. X-axis represents Time and Y-axis Throughput. Data is plotted on per minute basis with Throughput (Mb/s) in blue color and PIR value(Mb/s) in yellow color.
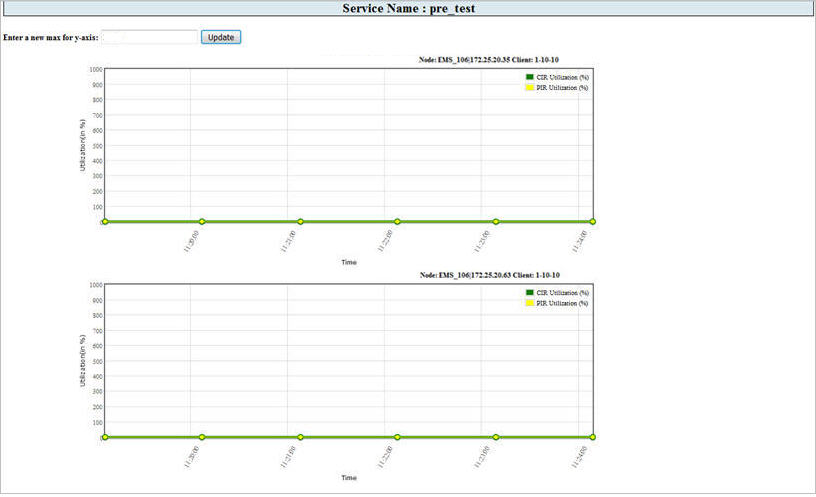
Two graphs indicates two end points of the service. X-axis represents Time and Y-axis Utilization (in %). Data is plotted on per minute basis with CIR Utilization (%) in green color and PIR Utilization (%) in yellow color.
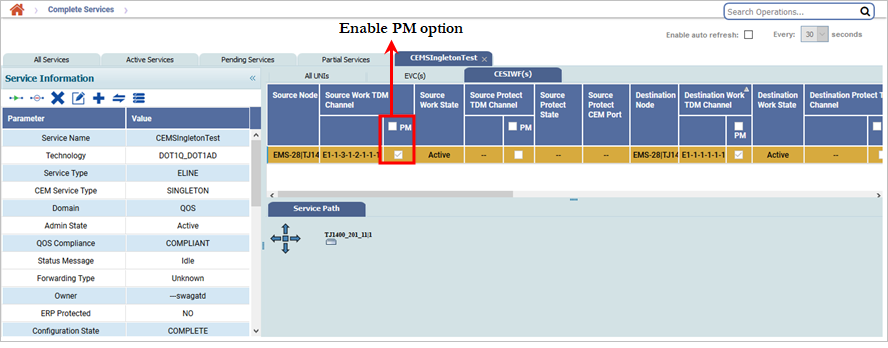
Enable PM on CESIWF(s) of Singleton CEM service
Perform the following steps to enable PM on CESIWF(s) of singleton CEM service.
The following figure shows the option to enable PM on Source Work TDM Channel. Similarly option is provided under source protect, destination, and destination protect TDM channels.
