![]()
![]()
![]()
![]()
|
|
|
|
|
The switch may generate messages in response to events, faults, or errors occurring on the platform as well as changes in configuration or other occurrences. These messages are stored both locally on the platform and forwarded to one or more centralized points of collection for monitoring purposes as well as long term archival storage. Local and remote configuration of the logging capability includes filtering of messages logged or forwarded based on severity and generating component.
The in‐memory log stores messages in memory based upon the settings for message component and severity. On stackable systems, this log exists only on the management unit. Other platforms in the stack forward their messages to the management unit log. Access to in‐memory logs on other than the management unit is not supported.
The buffered log stores messages in memory based upon the settings for message component and severity. Use the Buffered Log Configuration page to set the administrative status and behavior of logs in the system buffer.
To access the Buffered Log Configuration page, click System > Log > Buffered Log Configuration in the navigation menu.
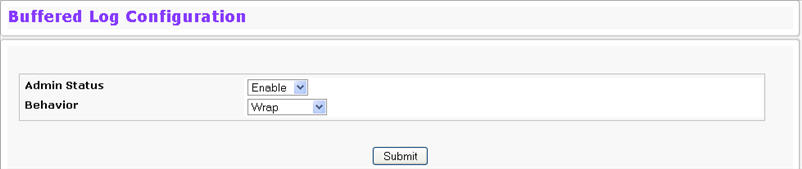
Buffered Log Configuration Fields
Field |
Description |
|---|---|
Admin Status |
Determines whether to log messages.
|
Behavior |
Indicates the behavior of the log when it is full.
|
If you change the buffered log settings, click Submit to apply the changes to the system. To preserve the changes after a system reboot, you must perform a save.
Use the Buffered Log page to view the log messages in the system buffer. The newest messages are displayed at the bottom of the page. To access the Buffered Log page, click System > Log > Buffered Log in the navigation menu.
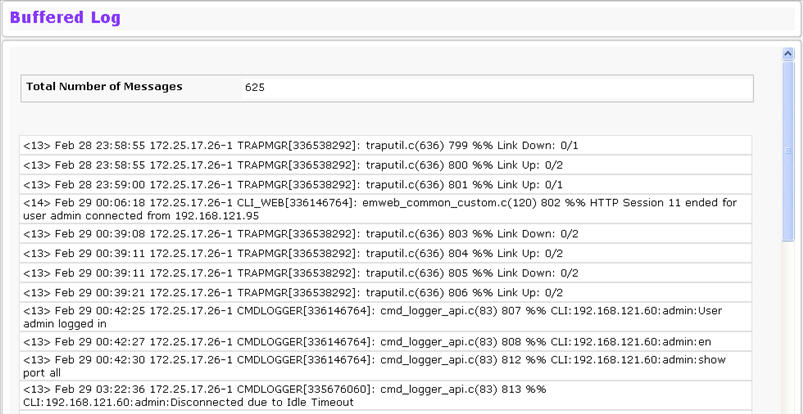
Buffered Log Fields
Field |
Description |
|---|---|
Total Number of Messages |
Shows the number of buffered messages the system has logged. Only the 128 most recent entries are displayed on the page. |
The rest of the page displays the buffered log messages. The following example shows a log message for a nonstacking system:
<15>Aug 24 05:34:05 STK0 MSTP[2110]: mspt_api.c(318) 237 %% Interface 12 transitioned to root state on message age timer expiry
This log message has a severity level of 7 (15 mod 8), which is a debug message. The system is not stacked (STK0). The message was generated by the MSTP component running in thread ID 2110. The message was generated on August 24 05:34:05 by line 318 of file mstp_api.c. This is the 237th message logged.
The following example shows a log message generated on a system that supports stacking:
<15>Aug 24 05:34:05 0.0.0.01 MSTP[2110]: mspt_api.c(318) 237 %% Interface 12 transitioned to root state on message age timer expiry
This log message has a severity level of 7 (15 mod 8), which is a debug message. The message was generated by the MSTP component running in thread id 2110. The message was generated on August 24 05:34:05 by line 318 of file mstp_api.c. This is the 237th message logged with system IP 0.0.0.0 and unit number 1.
Click Refresh to update the screen and associated messages.
Use the Command Logger Configuration page to enable the system to log all CLI commands issued on the system. The command log messages are interleaved with the other system logs messages.
To access the Command Logger Configuration page, click System > Log > Command Logger Configuration in the navigation menu.
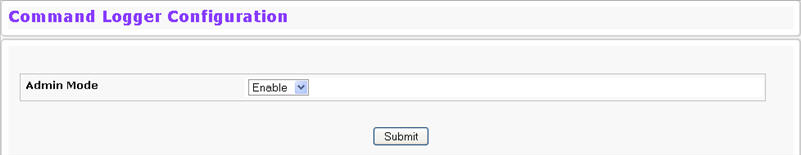
Command Logger Configuration Fields
Field |
Description |
|---|---|
Admin Mode |
This field determines whether to log CLI commands in the system log file.
|
If you change the administrative mode, click Submit to apply the change to the system.
Use the Console Log Configuration page to control logging to any serial device attached to the switch.
To access the Console Log Configuration page, click System > Log > Console Log Configuration in the navigation menu.
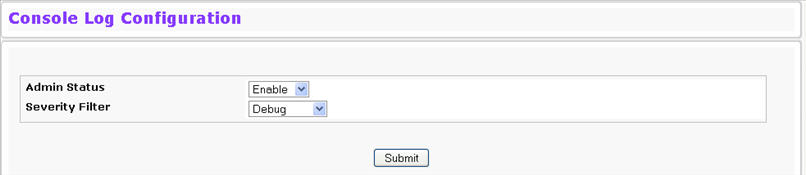
Console Log Configuration Fields
Field |
Description |
|---|---|
Admin Status |
From the menu, select whether to enable or disable console logging. The default is disabled.
|
Severity Filter |
Use the menu to select the severity of the logs to print to the console. Logs with the severity level you select and all logs of greater severity print. The default severity level is Alert(1). The severity can be one of the following levels:
|
Use the Event Log page to display the event log, which is used to hold error messages for catastrophic events. After the event is logged and the updated log is saved in flash memory, the switch will be reset. The log can hold at least 2,000 entries (the actual number depends on the platform and OS), and is erased when an attempt is made to add an entry after it is full. The event log is preserved across system resets.
To access the Event Log page, click System > Log > Event Log in the navigation menu.
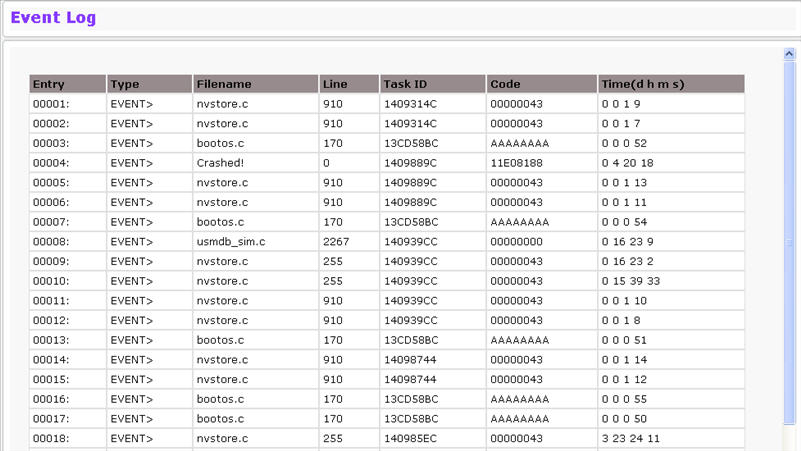
Event Log Fields
Field |
Description |
|---|---|
Entry |
The number of the entry within the event log. The most recent entry is first. |
Type |
Displays Event for every task performed on the node. |
Filename |
The TejNOS-EN source code filename identifying the code that detected the event. |
Line |
The line number within the source file of the code that detected the event. |
Task ID |
The OS‐assigned ID of the task reporting the event. |
Code |
The event code passed to the event log handler by the code reporting the event. |
Time |
The time the event occurred, measured from the previous reset. |
Click Refresh to update the screen and associated messages.
Use the Host Log Configuration page to configure remote logging hosts where the switch can send logs. To access the Host Log Configuration page, click System > Log > Host Log Configuration in the navigation menu.
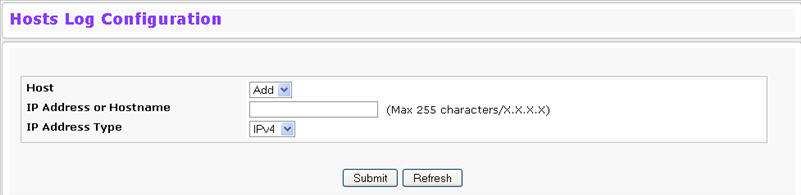
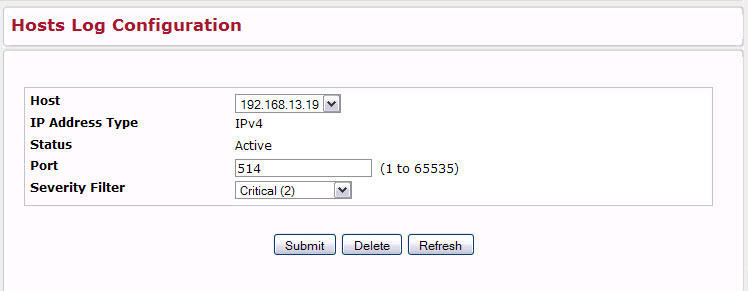
After you add a logging host, the screen displays additional fields indicated in the figure below:
Host Log Configuration Fields
Field |
Description |
|---|---|
Host |
Select a host from the list of hosts that have been configured to receive log messages. Select Add to add a new host, or select the IP address of an existing host to view or change the settings. |
IP Address or Hostname |
Enter the IP address or hostname of the host configured for syslog. |
IP Address Type |
Select the form of the address entered above:
|
Status |
Shows whether the remote logging host is currently active. |
Port |
Identifies the port on the host to which syslog messages are sent. The default port is 514. Specify the port in the text field. |
Severity Filter |
Use the menu to select the severity of the logs to send to the logging host. Logs with the selected severity level and all logs of greater severity are sent to the host. The default severity level is Alert(1). The severity can be one of the following levels:
|
Adding a Remote Logging Host
Use the following procedures to add, configure, or delete a remote logging host.
Deleting a Remote Logging Host
To delete a remote logging host from the configured list, select the IP address of the host from the Host field, and then click Delete.
The persistent log is stored in persistent storage, which means that the log messages are retained across a switch reboot.
NOTE: Some platforms do not support persistent logging. If your system does not support persistent logging, links to the Persistent Log Configuration and Persistent Log page are not present in the navigation menu.
Either the system startup log or the system operation log stores a message received by the log subsystem that meets the storage criteria, but not both. In other words, on system startup, if the startup log is configured, it stores messages up to its limit. The operation log, if configured, then begins to store the messages.
The system keeps up to three versions of the persistent logs, named <FILE>1.txt, <FILE>2.txt, and <FILE>3.txt. Upon system startup, <FILE>3.txt is removed, <FILE>2.txt is renamed <FILE>3.txt, <FILE>1.txt is renamed <FILE>2.txt, <FILE>1.txt is created and logging begins into <FILE>1.txt. (Replace <FILE> in the above example to specify olog for the operation log and slog for the startup log.)
The local persistent logs can be retrieved through the Web or CLI, or through xmodem over the local serial cable. To access the Persistent Log Configuration page, click System > Log > Persistent Log Configuration in the navigation menu.
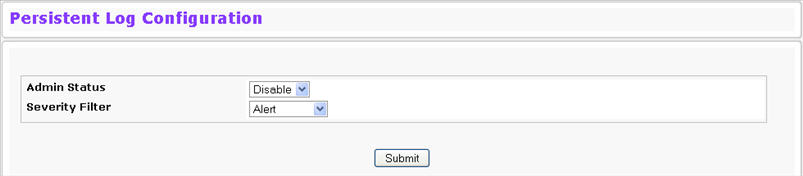
Persistent Log Configuration Fields
Field |
Description |
|---|---|
Admin Status |
Select whether to enable or disable persistent logging. The default is disabled.
|
Severity Filter |
Use the menu to select the severity of the logs to print to the console. Logs with the severity level you select and all logs of greater severity print. The default severity level is Alert(1). The severity can be one of the following levels:
|
Use the Persistent Log page to view the persistent log messages.
To access the Persistent Log page, click System > Log > Persistent Log in the navigation menu.
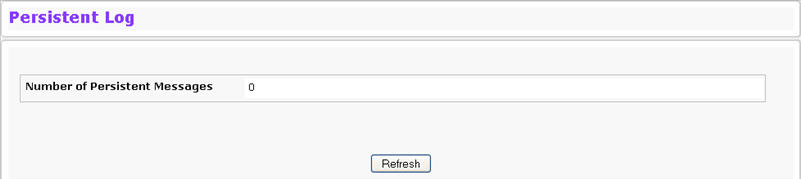
Persistent Log Fields
Field |
Description |
|---|---|
Total Number of Messages |
Shows the number of persistent messages the system has logged. |
The rest of the page displays the log messages. The following example shows a log message for a non-stacking system:
<15>Aug 24 05:34:05 STK0 MSTP[2110]: mspt_api.c(318) 237 %% Interface 12 transitioned to root state on message age timer expiry
This log message has a severity level of 7 (15 mod 8), which is a debug message. The system is not stacked (STK0). The message was generated by the MSTP component running in thread ID 2110. The message was generated on August 24 05:34:05 by line 318 of file mstp_api.c. This is the 237th message logged.
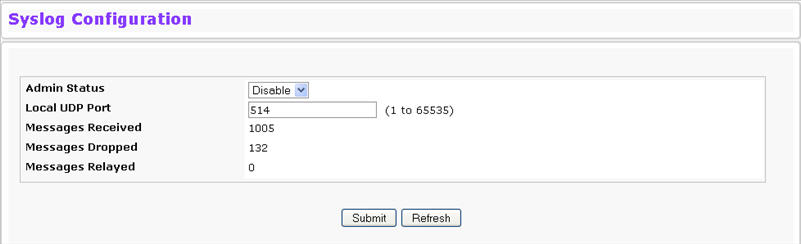
Use the Syslog Configuration page to allow the switch to send log messages to the remote logging hosts configured on the system. To access the Syslog Configuration page, click System > Log > Syslog Configuration in the navigation menu.
Syslog Configuration Fields
Field |
Description |
|---|---|
Admin Status |
Specifies whether to send log messages to the remote syslog hosts configured on the switch:
|
Local UDP Port |
Specifies the port on the switch from which syslog messages are sent. The default port is 514. |
Messages Received |
The number of messages received by the log process. This includes messages that are dropped or ignored. |
Messages Dropped |
The number of messages that could not be processed due to error or lack of resources. |
Messages Relayed |
The number of messages forwarded by the syslog function to a syslog host. Messages forwarded to multiple hosts are counted once for each host. |
If you make any changes to the page, click Submit to apply the change to the system.