![]()
![]()
![]()
![]()
|
|
|
|
|
The pages in the Port folder allow you to view and monitor the physical port information for the ports available on the switch. The Port folder has links to the following pages:
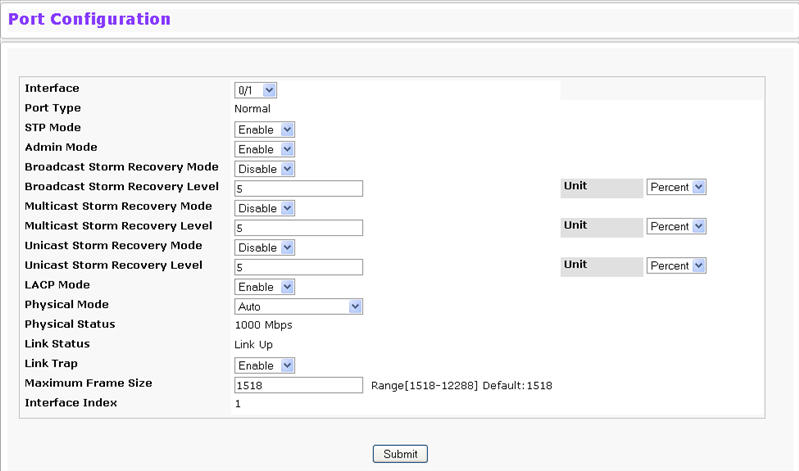
Use the Port Configuration page to configure the physical interfaces on the switch. To access the Port Configuration page, click System > Port >Configuration in the navigation menu.
Port Configuration Fields
Field |
Description |
|---|---|
Interface |
Select the port from the menu to display or configure data for that port. The field is Slot/Port for non‐stacking platforms. If you select All, the changes you make to the Port Configuration page apply to all physical ports on the system. |
Port Type |
For most ports this field is blank. Otherwise the possible values are:
|
STP Mode |
Shows the Spanning Tree Protocol (STP) Administrative Mode for the port or LAG. The possible values for this field are:
|
Admin Mode |
Use the pulldown menu to select the port control administration state, which can be one of the following:
|
Broadcast Storm Recovery Mode |
Enable or disable this option by selecting one of the following options on the pull down entry field:
|
Broadcast Storm Recovery Level |
Specify the data rate at which storm control activates. The factory default is 5 percent of port speed. In the Unit field, specify whether the level is measured as a percentage of the overall traffic on the port or the packets per second. |
Multicast Storm Recovery Mode |
Enable or disable this option by selecting one of the following options on the pull down entry field:
|
Multicast Storm Recovery Level |
Specify the data rate at which storm control activates. The factory default is 5 percent of port speed. In the Unit field, specify whether the level is measured as a percentage of the overall traffic on the port or the packets per second. |
Unicast Storm Recovery Mode |
Enable or disable this option by selecting one of the following options on the pull down entry field:
|
Unicast Storm Recovery Level |
Specify the data rate at which storm control activates. The factory default is 5 percent of port speed. In the Unit field, specify whether the level is measured as a percentage of the overall traffic on the port or the packets per second. |
LACP Mode |
Selects the Link Aggregation Control Protocol administration state:
|
Physical Mode |
Use the pulldown menu to select the port's speed and duplex mode. If the Unit/Slot/Port or Slot/Port field is set to All and you apply a physical mode other than Auto, the mode is applied to all applicable interfaces only:
|
Physical Status |
Indicates the port speed and duplex mode. |
Link Status |
Indicates whether the Link is up or down. |
Link Trap |
This object determines whether or not to send a trap when link status changes. The factory default is enabled:
|
Maximum Frame Size |
Indicates the maximum Ethernet frame size the interface supports or is configured to support. The frame size includes the Ethernet header, CRC, and payload. (1518 to 12288). The default maximum frame size is 1518. |
ifIndex |
The ifIndex of the interface table entry associated with this port. If the Unit/Slot/Port field is set to All, this field is blank. |
If you make any changes to the page, click Submit to apply the changes to the system.
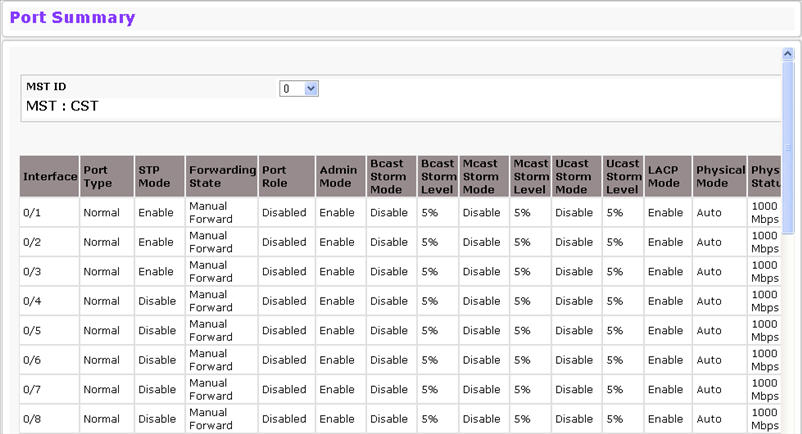
Use the Port Summary page to view the settings for all physical ports on the platform.
To access the Port Summary page, click System > Port > Summary in the navigation menu.
Port Summary Fields
Field |
Description |
|---|---|
MST ID |
If Spanning Tree Protocol is enabled on the switch, you can select the Multiple Spanning Tree instance ID from the list of all currently configured MST ID's to determine the values displayed for the Spanning Tree parameters. Changing the selected MST ID will generate a screen refresh. |
Interface |
Identifies the port that the information in the rest of the row is associated with. |
Port Type |
For most ports this field is blank. Otherwise, the possible values are:
|
STP Mode |
Shows the Spanning Tree Protocol (STP) Administrative Mode for the port or LAG, which can be Enabled or Disabled. |
Forwarding State |
The port's current state Spanning Tree state. This state controls what action a port takes on receipt of a frame. If the bridge detects a malfunctioning port it will place that port into the broken state. The other five states are defined in IEEE 802.1D:
|
Port Role |
Each MST Bridge Port that is enabled is assigned a Port Role for each spanning tree. The port role will be one of the following values: Root Port, Designated Port, Alternate Port, Backup Port, Master Port, or Disabled Port. |
Admin Mode |
Shows the port control administration state, which can be one of the following:
|
Bcast Storm Mode |
Shows whether the Broadcast Storm Recovery Mode, which can be one of the following:
|
Bcast Storm Level |
Shows the Broadcast Storm Recovery Level, which is the data rate at which storm control activates. The value is a percentage of port speed and ranges from 0‐100. The factory default is 5 percent of port speed. |
Mcast Storm Mode |
Shows the Multicast Storm Recovery Mode, which is one of the following:
|
Mcast Storm Level |
Shows the Multicast Storm Recovery Level, which is the data rate at which storm control activates. The value is a percentage of port speed and ranges from 0‐100. The factory default is 5 percent of port speed. |
Ucast Storm Mode |
Shows the Unicast Storm Recovery Mode, which can be one of the following:
|
Ucast Storm Level |
Shows the Unicast Storm Recovery Level, which is the data rate at which storm control activates. The value is a percentage of port speed and ranges from 0‐100.The factory default is 5 percent of port speed. |
LACP Mode |
Indicates the Link Aggregation Control Protocol administration state. The mode must be enabled in order for the port to participate in Link Aggregation. This field can have the following values:
|
Physical Mode |
Shows the speed and duplex mode at which the port is configured:
|
Physical Status |
Indicates the port speed and duplex mode at which the port is operating. |
Link Status |
Indicates whether the Link is up or down. |
Link Trap |
This object determines whether or not to send a trap when link status changes. The factory default is enabled.
|
Click Refresh to redisplay the most current information from the router.
Use the Port Description page to configure a human-readable description of the port.
To access the Port Description page, click System > Port > Port Description in the navigation menu.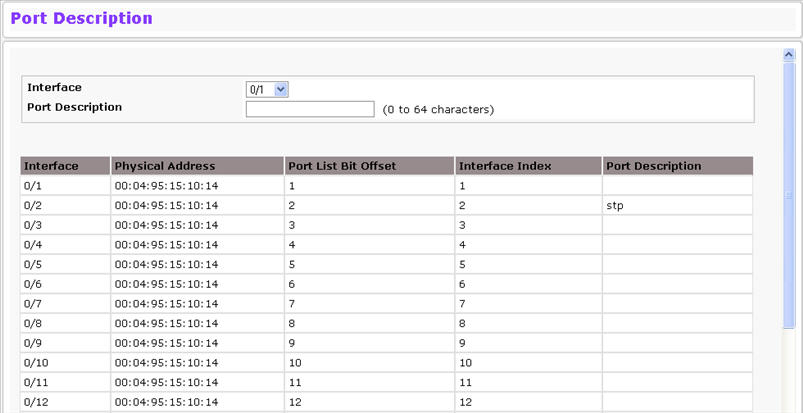
Port Description Fields
Field |
Description |
|---|---|
Interface |
Select the interface for which data is to be displayed or configured. |
Port Description |
Enter text to describe a port. It can be up to 64 characters in length. The description can contain spaces and non‐alphanumeric characters. |
Interface |
Identifies the port. |
Physical Address |
Displays the physical address of the specified interface. |
PortList Bit Offset |
Displays the bit offset value which corresponds to the port when the MIB object type PortList is used to manage in SNMP. |
IfIndex |
Displays the interface index associated with the port. |
Port Description |
Shows the configured port description. By default, the port does not have an associated description. |
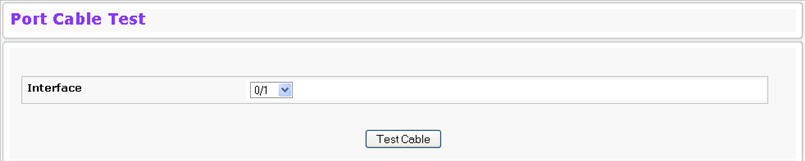
The cable test feature enables you to determine the cable connection status on a selected port. You can also obtain an estimate of the length of the cable connected to the port, if the PHY on the ports supports this functionality.
NOTE: The cable test feature is supported only for copper cable. It is not supported for optical fiber cable.
Cable Test Fields
Field |
Description |
|---|---|
Interface |
If the test has not been performed, this is the only field that displays. Select the interface to test. After the test has been performed, this field shows the interface that was tested |
Cable Status |
This displays the cable status as Normal, Open, or Short.
|
Cable Length |
Displays the estimated length of the cable in meters. The length is displayed as a range between the shortest estimated length and the longest estimated length. Unknown is displayed if the cable length could not be determined. This field is displayed only when the cable status is Normal |
Failure Location |
The estimated distance in meters from the end of the cable to the failure location. The failure location is only displayed if the cable status is Open or Short. |
Select a port and click Test Cable to display its status. If the port has an active link while the cable test is run, the link can go down for the duration of the test. The test may take several seconds to run.
The command returns a cable length estimate if this feature is supported by the PHY for the current link speed.
NOTE: If the link is down and a cable is attached to a 10/100 Ethernet adapter, then the cable status may display as Open or Short because some Ethernet adapters leave unused wire pairs unterminated or grounded.
Port mirroring selects the network traffic for analysis by a network analyzer. This is done for specific ports of the switch. As such, many switch ports are configured as source ports and one switch port is configured as a destination port. You have the ability to configure how traffic is mirrored on a source port. Packets that are received on the source port, that are transmitted on a port, or are both received and transmitted, can be mirrored to the destination port. The packet that is copied to the destination port is in the same format as the original packet on the wire. This means that if the mirror is copying a received packet, the copied packet is VLAN tagged or untagged as it was received on the source port. If the mirror is copying a transmitted packet, the copied packet is VLAN tagged or untagged as it is being transmitted on the source port. Use the Multiple Port Mirroring page to define port mirroring sessions. To access the Multiple Port Mirroring page, click System > Port > Multiple Port Mirroring in the navigation menu.
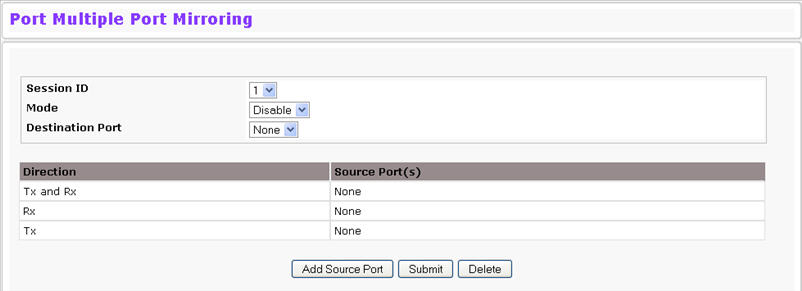
Multiple Port Mirroring Fields
Field |
Description |
|---|---|
Session |
Specifies the monitoring session. |
Mode |
Enables you to turn on of off Multiple Port Mirroring. The default is Disabled (off). |
Destination Port |
Select the port to which port traffic may be copied. |
Direction |
Specifies the direction of traffic on source port(s) which will be sent to the probe port. Possible values are:
|
Adding a Port Mirroring Session
NOTE: A Port will be removed from a VLAN or LAG when it becomes a destination mirror.
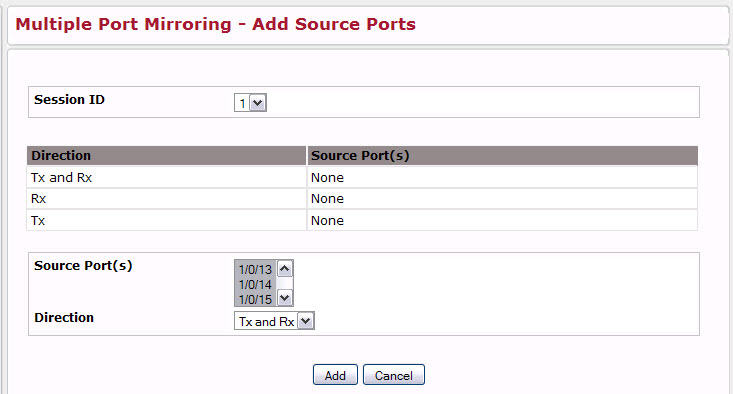
Multiple Port Mirroring-Add Source Ports Fields
Field |
Description |
|---|---|
Session |
Specifies the monitoring session. |
Source Port |
Select the unit and port from which traffic is mirrored. Up to eight source ports can be mirrored to a destination port. |
Direction |
Select the type traffic monitored on the source port, which can be one of the following:
|
Removing or Modifying a Port Mirroring Session