![]()
![]()
![]()
![]()
|
|
|
|
|
You can enable the Ethernet in the First Mile (EFM) Operations and Maintenance (OAM) protocol (IEEE 802.3ah) to view link operation data, such as remote fault indication and remote loopback control. This enables monitoring, testing, and troubleshooting OAM-enabled links in the network.
OAM-enabled interfaces communicate with each other using OAM PDUs, which include requests, indications, and control PDUs. OAM uses periodic advertisements to maintain an OAM discovery session and convey information on an Ethernet link enabled with an OAM client. Sessions are maintained by sending a minimal number of OAMPDUs per second, and such advertisements may contain management or fault signaling information.
You must enable OAM on each interface you want to collect information on. The protocol will not collect and display data for interfaces on which it is not enabled.
Use the EFM-OAM Protocol Status Page to view global information on OAM configuration on the switch, including which interfaces the protocol is enabled on, the OAM mode, and the status of each links To view this page, click Switching > EFM-OAM > Protocol Status.
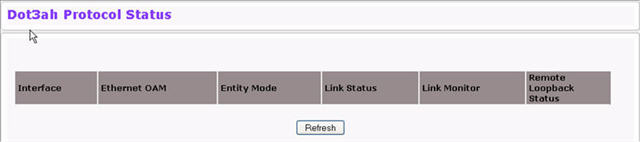
Dot3ah Protocol Status
Field |
Description |
|---|---|
Interface |
The slot/port on which OAM is enabled. |
Ethernet OAM |
Indicates whether OAM is enabled on the port. |
Entity Mode |
Indicates whether passive or active mode OAM is enabled. The client in passive mode cannot initiate a discovery process. A passive entity will listen for the Information OAM PDUs from an active entity. The passive entity can send any other PDUs (Event notification, info PDUs) only after the discovery process is successful. By default, ports are placed in passive mode. An active-mode OAM entity can put a passive-mode OAM entity into loopback mode, but not vice versa. |
Link Status |
The status of the OAM link. NOTE: A Link Failure message pertains only to OAM operation and does not indicate that the physical port is down. |
Link Monitor |
The Dot3ah - 802.3ah link monitoring is on or off on the interface. |
Remote Loopback Status |
The Dot3ah - 802.3ah Remote Loopback Status of the port where Local OAM entity is executing 'Remote Loopback' procedure. |
Click Refresh to redisplay the page with the latest information from the switch.
Use the EFM-OAM Interface Configuration Page to enable the protocol on specified interfaces and to select the mode of operation. To view this page, click Switching > EFM-OAM > Interface Configuration.
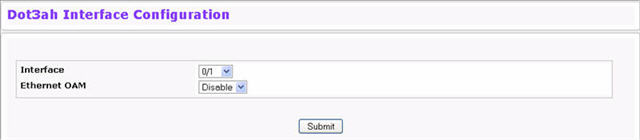
When you select an interface and select Enable in the Ethernet OAM list, the page redisplays with additional configuration options:
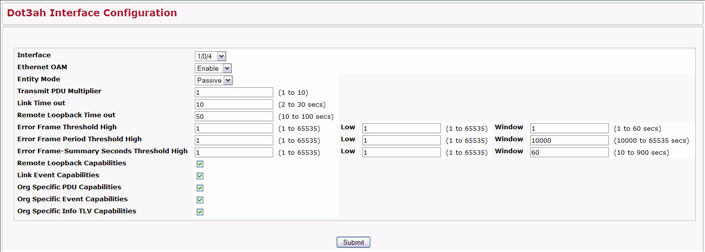
Dot3ah Interface Configuration
Field |
Description |
|---|---|
Interface |
Select the slot/port to configure. |
Ethernet OAM |
Enable or disable the Ethernet OAM on an interface. |
Ethernet Entity Mode |
Select Active or Passive. An active-mode device can exert more control on its peer than a passive-mode device. |
Ethernet Transmit PDU Multiplier |
Enter the multiplier on the transmit interval that sets the TTL in local data LLDPDUs. The multiplier range is 2-10. |
Link Timeout |
Enter the link lost timer value to 2-30 seconds. If no OAM PDUs are received from the remote device within this time period, the local client is placed in the Link Fault state. |
Remote Loopback Timeout |
If the remote client is not ready to take part in the remote loopback initiated by an active entity, the process fails after a remote-loopback time-out period. Enter the delay before re-initialization. The range is 1--0 seconds. |
Error Frame Threshold High / Low / Window |
Enter the error threshold high value and low value in number of symbols from 0-65535. Enter a window in seconds. The window is used to calculate and generate a trap if the errors are crossing the thresholds within the window time frame. The default is 0 for high and 1 for low. |
Error Frame Period Threshold High / Low / Window |
Enter the high and low thresholds for error frames that trigger an error-frame link event. |
Error Frame-Summary Seconds Threshold High / Low / Window |
Enter the high and low thresholds for the error-frame seconds that triggers an error-frame seconds link event. |
Remote Loopback Capabilities |
Select to enable Remote Loopback support. |
Link Event Capabilities |
Select to enable the interface to monitor link events. |
Org Specific PDU Capabilities |
Select to configure OAM discovery to be based on Organizationally Unique Identifier (OUI) information and the Source MAC address combination. |
Org Specific Event Capabilities |
Select to send organizational specific event TLVs in the OAMDPUs. |
Org Specific Info TLV Capabilities |
Select to support interpreting Organization Specific Information TLVs. |
If you change any of the settings on the page, click Submit to apply the changes to system.
Use the Interface Summary page to display configuration information for each OAM-enabled link on the switch. To view this page, click Switching > EFM-OAM > Interface Summary.
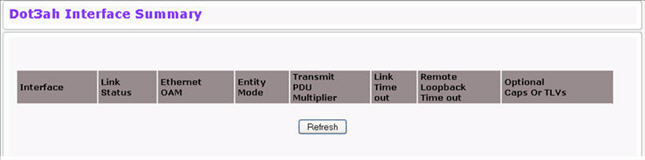
Click Refresh to redisplay the page with the latest information from the switch.
Use this page to view statistics on OAM-enabled links. To display this page, click Switching > EFM-OAM > OAM Statistics.
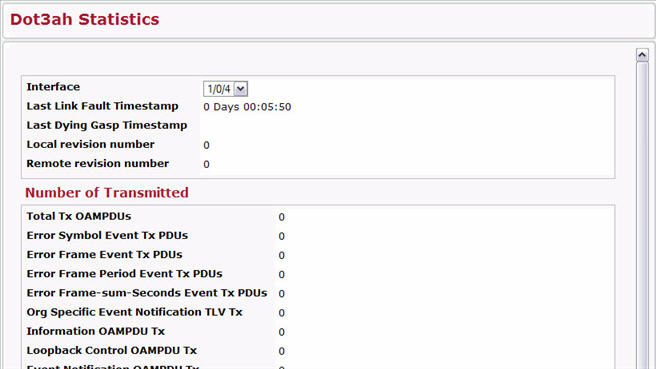
Click Refresh to redisplay the page with the latest information from the switch.
Dot3ah Statistics Fields
Field |
Description |
|---|---|
Interface |
Specifies all configured interfaces for Dot3ah. |
Last Link Fault Timestamp |
Last Link fault time occurred on this interface specified in Days:Hours;Mins:Secs format. |
Last Dying Gasp Timestamp |
Last Dying Gasp event time occurred on this interface specified in Days:Hours;Mins:Secs format. |
Local revision Number |
The Dot3ah local revision number on this interface. |
Remote Revision Number |
The Dot3ah remote revision number on this interface. |
Total Tx OAM PDUs |
The number of OAM messages Transmitted on this interface. |
Error Symbol Event Tx PDUs |
The number of Error Symbol Event Notification OAMPDUs Transmitted on this interface. |
Error Frame Event Tx PDUs |
The number of Error Frame Event Notification OAMPDUs Transmitted on this interface. |
Error Frame Period Event Tx PDUs |
The number of Error Frame Period Event Notification OAMPDUs Transmitted on this interface. |
Error Frame-sum‐Seconds Event Tx PDUs |
The number of Error Frame-sum‐Seconds Event Notification OAMPDUs Transmitted on this interface. |
Org Specific Event Notification TLV Tx |
The number of Org Specific Event Notification OAMPDUs Transmitted on this interface. |
Information OAMPDU Tx |
The number of Information OAMPDUs Transmitted on this interface. |
Loopback Control OAMPDU Tx |
The number of Loopback OAMPDUs Transmitted on this interface. |
Event Notification OAMPDU Tx |
The number of Event Notification OAMPDUs Transmitted on this interface. |
ORG Specific OAMPDU Tx |
The number of Org Specific OAMPDUs Transmitted on this interface. |
Variable Request OAMPDU Tx |
The number of Variable Request OAMPDUs Transmitted on this interface. |
Variable Response OAMPDU Tx |
The number of Variable Request OAMPDUs Transmitted on this interface. |
Information OAMPDU Tx |
The number of Invalid OAMPDUs Transmitted on this interface. |
Total Rx OAM PDUs |
The number of OAM messages Received on this interface. |
Error Symbol Event Rx PDUs |
The number of Error Symbol Event Notification OAMPDUs Received on this interface. |
Error Frame Event Rx PDUs |
The number of Error Frame Event Notification OAMPDUs Received on this interface. |
Error Frame Period Event Rx PDUs |
The number of Error Frame Period Event Notification OAMPDUs Received on this interface. |
Error Frame-sum-Seconds Event Rx PDUs |
The number of Error Frame-sum-Seconds Event Notification OAMPDUs Received on this interface. |
Org Specific Event Notification TLV Rx |
The number of Org Specific Event Notification OAMPDUs Received on this interface. |
Information OAMPDU Rx |
The number of Information OAMPDUs Received on this interface. |
Loopback Control OAMPDU Rx |
The number of Loopback OAMPDUs Received on this interface. |
Event Notification OAMPDU Rx |
The number of Event Notification OAMPDUs Received on this interface. |
ORG Specific OAMPDU Rx |
The number of Org Specific OAMPDUs Received on this interface. |
Variable Request OAMPDU Rx |
The Number of Variable Request OAMPDUs Received on this interface. |
Variable Response OAMPDU Rx |
The Number of Variable Request OAMPDUs Received on this interface. |
Information OAMPDU Rx |
The Number of Invalid OAMPDUs Received on this interface. |
Total Nodes |
The number of Discovered Nodes on this interface. Currently Local-Entity can learn one Peer on an Interface. |
Number Times Nodes Added |
Number of times Remote client added to Discovery table on this interface. |
Number of times Discovered Node Removed |
The number of times Discovered Node removed on this interface. |
Fail to add Peer to Discovery db |
Number Times Failed to add remote client to Discovery db on this interface. |
Total Illegal OAM messages Received |
The number of invalid OAMPDUs transmitted on this interface. |
Total Failed to Transmit OAM Messages |
The number of invalid OAMPDUs received on this interface. |
Total Errored OAM Transmitted PDUs |
The number of FrameError OAMPDUs transmitted on this interface. |
Total Errored OAM Transmitted Events |
The number of FrameError OAMPDUs transmitted on this interface. |
Total Bad Src MAC OAM PDUs Received |
The number of Illegal Source MAC address OAMPDUs received on this interface. |
Total Bad Dst MAC OAM PDUs Received |
The number of Illegal Destination MAC address OAMPDUs received on this interface. |
Total OAM Messages Intercepted in Queue |
The number of OAM messages intercepted on this interface. |
Total OAM Messages Processed from Queue |
The number of OAM messages processed on this interface. |
Total OAM Messages Transmitted |
The number of OAM messages Transmitted on this interface. |
Total OAM Messages Received |
The number of OAM messages processed on this interface. |
Total OAM Messages Filtered |
The number of OAM messages Filtered on this interface. |
Click Refresh to redisplay the page with the latest information from the switch.
Use this page to view Y.1731statistics.
Y.1731 counters for current interval
Parameter |
Description |
|---|---|
NearEnd Frame Loss |
Displays the frame loss that is associated with ingress data frames. |
FarEnd Frame Loss |
Displays the frame loss that is associated with egress data frames. |
DmFramesReceived |
Displays the number of DM frames received. |
Average Delay (uSec) |
Displays the average round trip time of DM frame in the current interval. |
Maximum Delay (uSec) |
Displays the maximum round trip time of DM frames in the current interval. |
Minimum Delay (uSec) |
Displays the minimum round trip time of DM frames in the current interval. |
Idle Seconds |
Idle second counter will increment when there is no transmitter and receiver transmission and there is no alarm in the tunnel path. |
Near End Frame Loss Ratio |
Displays the number of frames lost ratio at near end. |
Far End Frame Loss Ratio |
Displays the number of frames lost ratio at far end. |
Unavailable Seconds |
Displays the number of seconds an alarm in path was present in current interval. |
Interval Valid |
Indicates the validity of data in the current interval. |
Y.1731 counters for 15 min Interval
Parameter |
Description |
|---|---|
Start Time |
Start time of the interval. |
End Time |
End time of the interval. |
NearEnd Frame Loss |
Displays the frame loss that is associated with ingress data frames. |
FarEnd Frame Loss |
Displays the frame loss that is associated with egress data frames. |
DmFramesReceived |
Displays the number of DM frames received. |
Average Delay (uSec) |
Displays the average round trip time of DM frame in the 15 min interval. |
Maximum Delay (uSec) |
Displays the maximum round trip time of DM frames in the 15 min interval. |
Minimum Delay (uSec) |
Displays the minimum round trip time of DM frames in the 15 min interval. |
Idle Seconds |
Idle second counter will increment when there is no transmitter and receiver and Rx transmission and there is no alarm in the tunnel path. |
Near End Frame Loss Ratio |
Displays the number of frames lost ratio at near end. |
Far End Frame Loss Ratio |
Displays the number of frames lost ratio at far end. |
Unavailable Seconds |
Displays number of seconds an alarm in path was present in the 15 min interval. |
Interval Valid |
Indicates the validity of data in the 15 min interval. |
Y.1731 counters for previous day
Parameter |
Description |
|---|---|
End Time |
End time of the interval. |
NearEnd Frame Loss |
Displays the frame loss that is associated with ingress data frames. |
FarEnd Frame Loss |
Displays the frame loss that is associated with egress data frames. |
DmFramesReceived |
Displays the number of DM frames received. |
Average Delay (uSec) |
Displays the average round trip time of DM frame the previous day. |
Maximum Delay (uSec) |
Displays the maximum round trip time of DM frames the previous day. |
Minimum Delay (uSec) |
Displays the minimum round trip time of DM frames in the previous day. |
Idle Seconds |
Idle second counter will increment when there is no transmitter and receiver transmission and there is no alarm in the tunnel path. |
Near End Frame Loss Ratio |
Displays the number of frames lost ratio at near end. |
Far End Frame Loss Ratio |
Displays the number of frames lost ratio at far end. |
Unavailable Seconds |
Displays the number of seconds an alarm in path was present the previous day. |
Interval Valid |
Indicates the validity of data the previous day. |
The Link Status page displays status information for each OAM-enabled interface on the switch. To view this page, click Switching > EFM-OAM > Link Status.
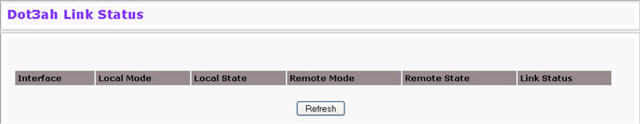
Click Refresh to redisplay the page with the latest information from the switch.
The Local Device Summary page displays information gathered through the OAM protocol on the switch’s network port. To view this page, click Switching > EFM-OAM > Local Device Summary.
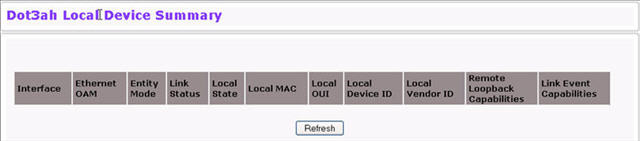
Click Refresh to redisplay the page with the latest information from the switch.
The Remote Device Summary page display information gathered through the OAM protocol on interfaces discovered through OAM on the remote network. To view this page, click Switching > EFM-OAM > Remote Device Summary.
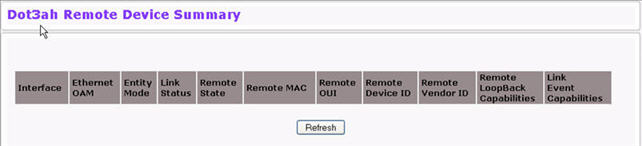
Click Refresh to redisplay the page with the latest information from the switch.
Use the Link Monitoring page to configure an interface for link monitoring. To view this page, click Switching > EFM-OAM > Link Monitoring.
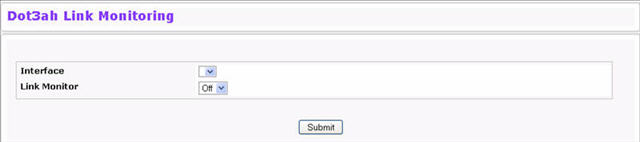
To enable link monitoring on an interface, select the interface from the list, wait until the page redisplays, and select On from the link monitor field. Click Submit to update the switch.
Use the Link Monitoring page to view per-interface link monitoring statistics. To view this page, click Switching > EFM-OAM > Link Monitoring statistics.
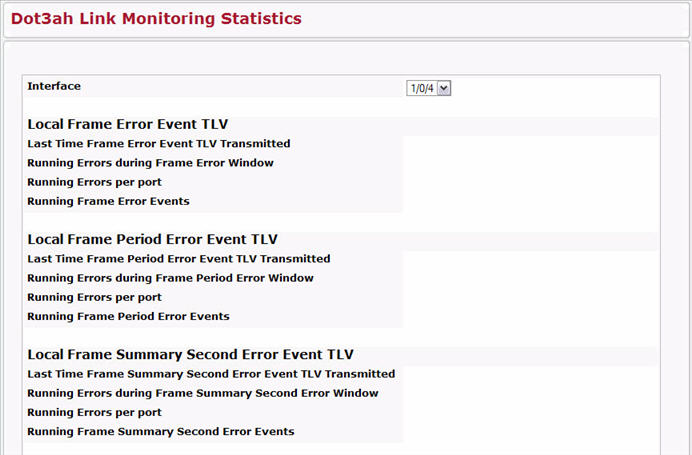
Dot3ah Link Monitoring Statistics Fields
Field |
Description |
|
|---|---|---|
Interface |
The list of all EFM-OAM configured interfaces for which link monitoring is ON at least once. |
|
Local Frame Error Event TLV |
||
Last Time Frame Error Event TLV Transmitted |
Timestamp when the last Frame Error Event TLV transmitted on this interface. |
|
Running Errors during Frame Error Window |
The total number of running Frame errors during Error Frame window transmitted on this interface. |
|
Running Errors per port |
The total number of running Frame errors transmitted on this interface. |
|
Running Frame Error Events |
The total number of Error Frame event TLVs transmitted on this interface. |
|
Local Frame Period Error Event TLV |
||
Last Time Frame Period Error Event TLV Transmitted |
Timestamp when the last Frame Error Event TLV transmitted on this interface. |
|
Running Errors during Frame Period Error Window |
The total number of running Frame errors during Error Frame window transmitted on this interface. |
|
Running Errors per port |
The total number of running Frame errors transmitted on this interface. |
|
Running Frame Period Error Events |
The total number of Error Frame event TLVs transmitted on this interface. |
|
Local Frame Summary Second Error Event TLV |
||
Last Time Frame Summary Second Error Event TLV Transmitted |
Timestamp when the last Frame Second Summary Error Event TLV transmitted on this interface. |
|
Running Errors during Frame Summary Second Error Window |
The total number of running Frame Second Summary errors during error Frame Second Summary window transmitted on this interface. |
|
Running Errors per port |
The total number of running Frame Second Summary errors transmitted on this interface. |
|
Running Frame Summary Second Error Events |
The total number of Error Frame Second Summary event TLVs transmitted on this interface. |
|
Remote Frame Error Event TLV |
||
Last Time Frame Error Event TLV Received |
Timestamp when the last Frame Error Event TLV received on this interface. |
|
Running Errors during Frame Error Window |
The total number of running Frame errors during Error Frame window received on this interface. |
|
Running Errors per port |
The total number of running Frame errors received on this interface. |
|
Running Frame Error Events |
The total number of Error Frame event TLVs received on this interface. |
|
Remote Frame Period Error Event TLV |
||
Last Time Frame Period Error Event TLV Received |
Timestamp when the last Frame Error Event TLV received on this interface. |
|
Running Errors during Frame Period Error Window |
The total number of running Frame errors during Error Frame window received on this interface. |
|
Running Errors per port |
The total number of running Frame errors received on this interface. |
|
Running Frame Period Error Events |
The total number of Error Frame event TLVs received on this interface. |
|
Remote Frame Summary Second Error Event TLV |
||
Last Time Frame Summary Second Error Event TLV Received |
Timestamp when the last Frame Second Summary Error Event TLV received on this interface. |
|
Running Errors during Frame Summary Second Error Window |
The total number of running Frame Second Summary errors during error Frame Second Summary window received on this interface. |
|
Running Errors per port |
The total number of running Frame Second Summary errors received on this interface. |
|
Running Frame Summary Second Error Events |
The total number of Error Frame Second Summary event TLVs received on this interface. |
|
Click Refresh to redisplay the page with the latest information from the switch.
Use the Remote Loopback page to initiate a loopback on a link. When a loopback is performed, every frame received on the selected port is transmitted back on that same port, except for OAMPDUs.
To view this page, click Switching > EFM-OAM > Remote Loopback.
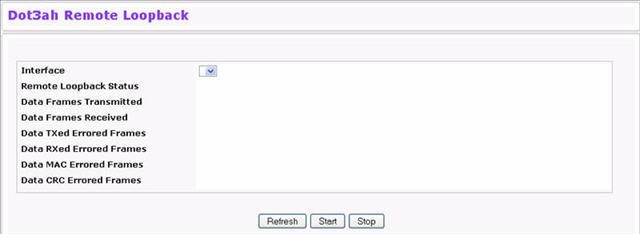
To initiate a remote loopback on an interface, select the interface from the list and click Start.